
Tottenham Hotspur led the Premier League after ten games in 2023/24, with 26 points from eight wins and two draws. The table below freezes the league at the end of 30 October 2023, after Matchweek 10. It is a historical snapshot of the opening part of that campaign, rather than the final 2023/24 standings or today's Premier League table.
That distinction matters because an impressive October position does not settle a season. Read the points and tie-order first, then compare what happened over the remaining matches. Later administrative decisions also need their own dates: applying a sanction retrospectively to an earlier snapshot can produce a table that was never the table at the time. For the eventual standings, use the separate historical final-tables guide; this page explains the ten-game moment and what changed afterwards.
The full Premier League table after ten games in 2023/24
This snapshot includes completed league matches up to the end of 30 October 2023, UK time. Matchweek 10's last fixtures had been played on 29 October, so the extra date does not add another result. At this cutoff, all twenty clubs had played ten matches: 100 matches in total. The figures are calculated from those completed results, with later games and administrative deductions left outside the October boundary.
| Pos | Club | P | W | D | L | GF | GA | GD | Pts |
|---|---|---|---|---|---|---|---|---|---|
| 1 | Tottenham Hotspur | 10 | 8 | 2 | 0 | 22 | 9 | +13 | 26 |
| 2 | Arsenal | 10 | 7 | 3 | 0 | 23 | 8 | +15 | 24 |
| 3 | Manchester City | 10 | 8 | 0 | 2 | 22 | 7 | +15 | 24 |
| 4 | Liverpool | 10 | 7 | 2 | 1 | 23 | 9 | +14 | 23 |
| 5 | Aston Villa | 10 | 7 | 1 | 2 | 26 | 14 | +12 | 22 |
| 6 | Newcastle United | 10 | 5 | 2 | 3 | 26 | 11 | +15 | 17 |
| 7 | Brighton & Hove Albion | 10 | 5 | 2 | 3 | 23 | 19 | +4 | 17 |
| 8 | Manchester United | 10 | 5 | 0 | 5 | 11 | 16 | -5 | 15 |
| 9 | West Ham United | 10 | 4 | 2 | 4 | 16 | 17 | -1 | 14 |
| 10 | Brentford | 10 | 3 | 4 | 3 | 16 | 12 | +4 | 13 |
| 11 | Chelsea | 10 | 3 | 3 | 4 | 13 | 11 | +2 | 12 |
| 12 | Wolverhampton Wanderers | 10 | 3 | 3 | 4 | 13 | 17 | -4 | 12 |
| 13 | Crystal Palace | 10 | 3 | 3 | 4 | 8 | 13 | -5 | 12 |
| 14 | Fulham | 10 | 3 | 3 | 4 | 9 | 16 | -7 | 12 |
| 15 | Everton | 10 | 3 | 1 | 6 | 10 | 14 | -4 | 10 |
| 16 | Nottingham Forest | 10 | 2 | 4 | 4 | 10 | 15 | -5 | 10 |
| 17 | Bournemouth | 10 | 1 | 3 | 6 | 8 | 21 | -13 | 6 |
| 18 | Luton Town | 10 | 1 | 2 | 7 | 9 | 20 | -11 | 5 |
| 19 | Burnley | 10 | 1 | 1 | 8 | 8 | 25 | -17 | 4 |
| 20 | Sheffield United | 10 | 0 | 1 | 9 | 7 | 29 | -22 | 1 |
P means played; W, D and L record wins, draws and losses; GF and GA are goals for and against; GD is their difference. Points come from three for a win and one for a draw. Tottenham's eight wins supplied 24 points, and their two draws took the total to 26. This is a fixed record of those results, so a modern form guide or a later sanction should not silently alter the numbers.
Equal games played makes this a convenient comparison point, but it does not mean the teams had faced equally difficult opponents. Each club's ten matches were a different sample from the eventual 38. The table establishes what had been achieved, rather than proving what the next seven months would produce. Use it to understand the early campaign, then consult the final standings by season when you want the completed outcome.
Why Tottenham led a tightly packed top five
Tottenham's unbeaten record was the clearest feature of the table. Eight victories and two draws put them on 26 points, two ahead of both Arsenal and Manchester City. It was an exceptional start for Spurs, but the size of the lead needs to sit alongside the achievement: Liverpool were three points behind, and Aston Villa were four behind. Five clubs were separated by the value of little more than one win and a draw.
The timing of a headline also changes the apparent gap. Spurs won at Crystal Palace on Friday 27 October, before their closest rivals played that weekend. A report describing a temporary five-point advantage on Friday is not the same table as the completed-round snapshot. Once the other results were included, the lead over Arsenal and City was two points. Freeze the whole comparison at one moment rather than combining Friday's lead with Sunday's totals.
The fair conclusion was that Tottenham had earned a strong position, not that a title had already been secured. The record rewarded wins and consistency; it did not account for every opponent still to come or guarantee that the same pace would continue. The guide to Premier League table scenarios explains why points gaps and remaining matches are more useful than treating a position number as a completed outcome.

Why Arsenal were above Manchester City on the same points
Arsenal and Manchester City both had 24 points and a goal difference of +15. The next comparison was goals scored: Arsenal had 23, City 22. That put Arsenal second and City third. There was no need to invoke alphabetical order, a head-to-head result or an expected-goals model. The ordinary points, goal-difference and goals-scored sequence resolved this particular tie.
Their routes to 24 points were different. City's eight wins yielded all 24, with no draws and two defeats. Arsenal had seven wins, worth 21 points, plus three draws. Being unbeaten did not earn an extra bonus, and City's extra win did not override the total once those draws had been counted. Similarly, City's seven goals conceded were fewer than Arsenal's eight, but goals conceded alone were not the next ranking criterion after equal points.
This is a useful example when reading any crowded table. Start with points, compare goal difference if needed, then check goals for. Stop when the tie is resolved. The current table's rules explanation helps with those columns, but its live standings belong to another season. Neither Arsenal's October advantage in the order nor City's eight wins was, on its own, a verdict on who would finish higher in May.
Liverpool and Aston Villa were still within reach
Liverpool were fourth on 23 points after beating Nottingham Forest 3-0 in the tenth round. Aston Villa were fifth on 22 after a 3-1 win against Luton. Both clubs had seven wins; the difference between them was one additional Liverpool draw. Their place numbers can sound more distant than their points totals: Liverpool were only three behind Tottenham, Villa four. One weekend's combination of results could substantially change that picture.
Ten games also left 28 of the 38 league matches per club still to play, offering a mathematical maximum of 84 more points. That does not mean any club was likely to win every remaining game. It shows why the October position was a starting point for the next phase of the campaign, rather than a settled allocation of the title or European places.
The goals columns add context without replacing the points. Villa had scored 26 times and Liverpool 23, while Liverpool had conceded nine against Villa's fourteen. Those figures describe different early records, not a complete forecast of sustainability. They do not adjust for the opponents already faced, the next fixtures or changes over a long season. A careful reading recognises both clubs' proximity to the lead while leaving the eventual outcome open at that historical moment.
What the middle and bottom of the table showed
Manchester United were eighth on 15 points despite scoring eleven goals and conceding sixteen. Chelsea, with a positive goal difference of +2, were eleventh on twelve points. That is not a table error. United's five wins produced more points than Chelsea's three wins and three draws. Goal difference becomes a ranking criterion when points are equal; it does not allow a club on fewer points to jump a rival because its overall scoring balance looks healthier.
Chelsea, Wolves, Crystal Palace and Fulham formed a four-club group on twelve points, each with three wins, three draws and four defeats. Their goal differences separated them: +2, -4, -5 and -7 respectively. The same W/D/L record can conceal different scoring patterns, while consecutive place numbers can exaggerate the distance between sides. Here the points gap from eleventh to fourteenth was zero, so one additional result could move a team through several places.
Near the bottom, Bournemouth had six points, followed by Luton on five, Burnley on four and Sheffield United on one. Everton and Nottingham Forest were both on ten, creating another gap above that group. The Blades' winless record and -22 goal difference described a difficult start, but the relegation places were not yet final. Premier League relegation follows the completed season. A ten-game table can identify the immediate problem and the gap to nearby clubs; it cannot certify survival or relegation with 28 matches still available.
Why Everton's later deductions do not belong in this snapshot
Everton's October record was three wins, one draw and six defeats: ten points, in fifteenth place. The first ten-point deduction was announced on 17 November 2023 and took immediate effect then. That was after this page's cutoff. Subtracting those ten points from the October total would mix two different dates and erase the distinction between the table before the decision and the table after it.
The later sequence also needs care. On 26 February 2024, the appeal decision replaced the original ten-point sanction with six points. A separate two-point deduction remained after Everton withdrew its appeal in May. The original ten and its replacement six were not cumulative penalties to be added together. Those later changes help explain why a season-end record needs administrative notes as well as match results.
For this snapshot, the question is what applied at the October date, not which final adjustment is visible in a later archive. Keep the ten earned points here and read later decisions in their own chronological place. When comparing with the final 2023/24 table, use that completed table's sanctions and notes rather than applying its adjustment backwards to every earlier date.
What changed between ten games and the final table
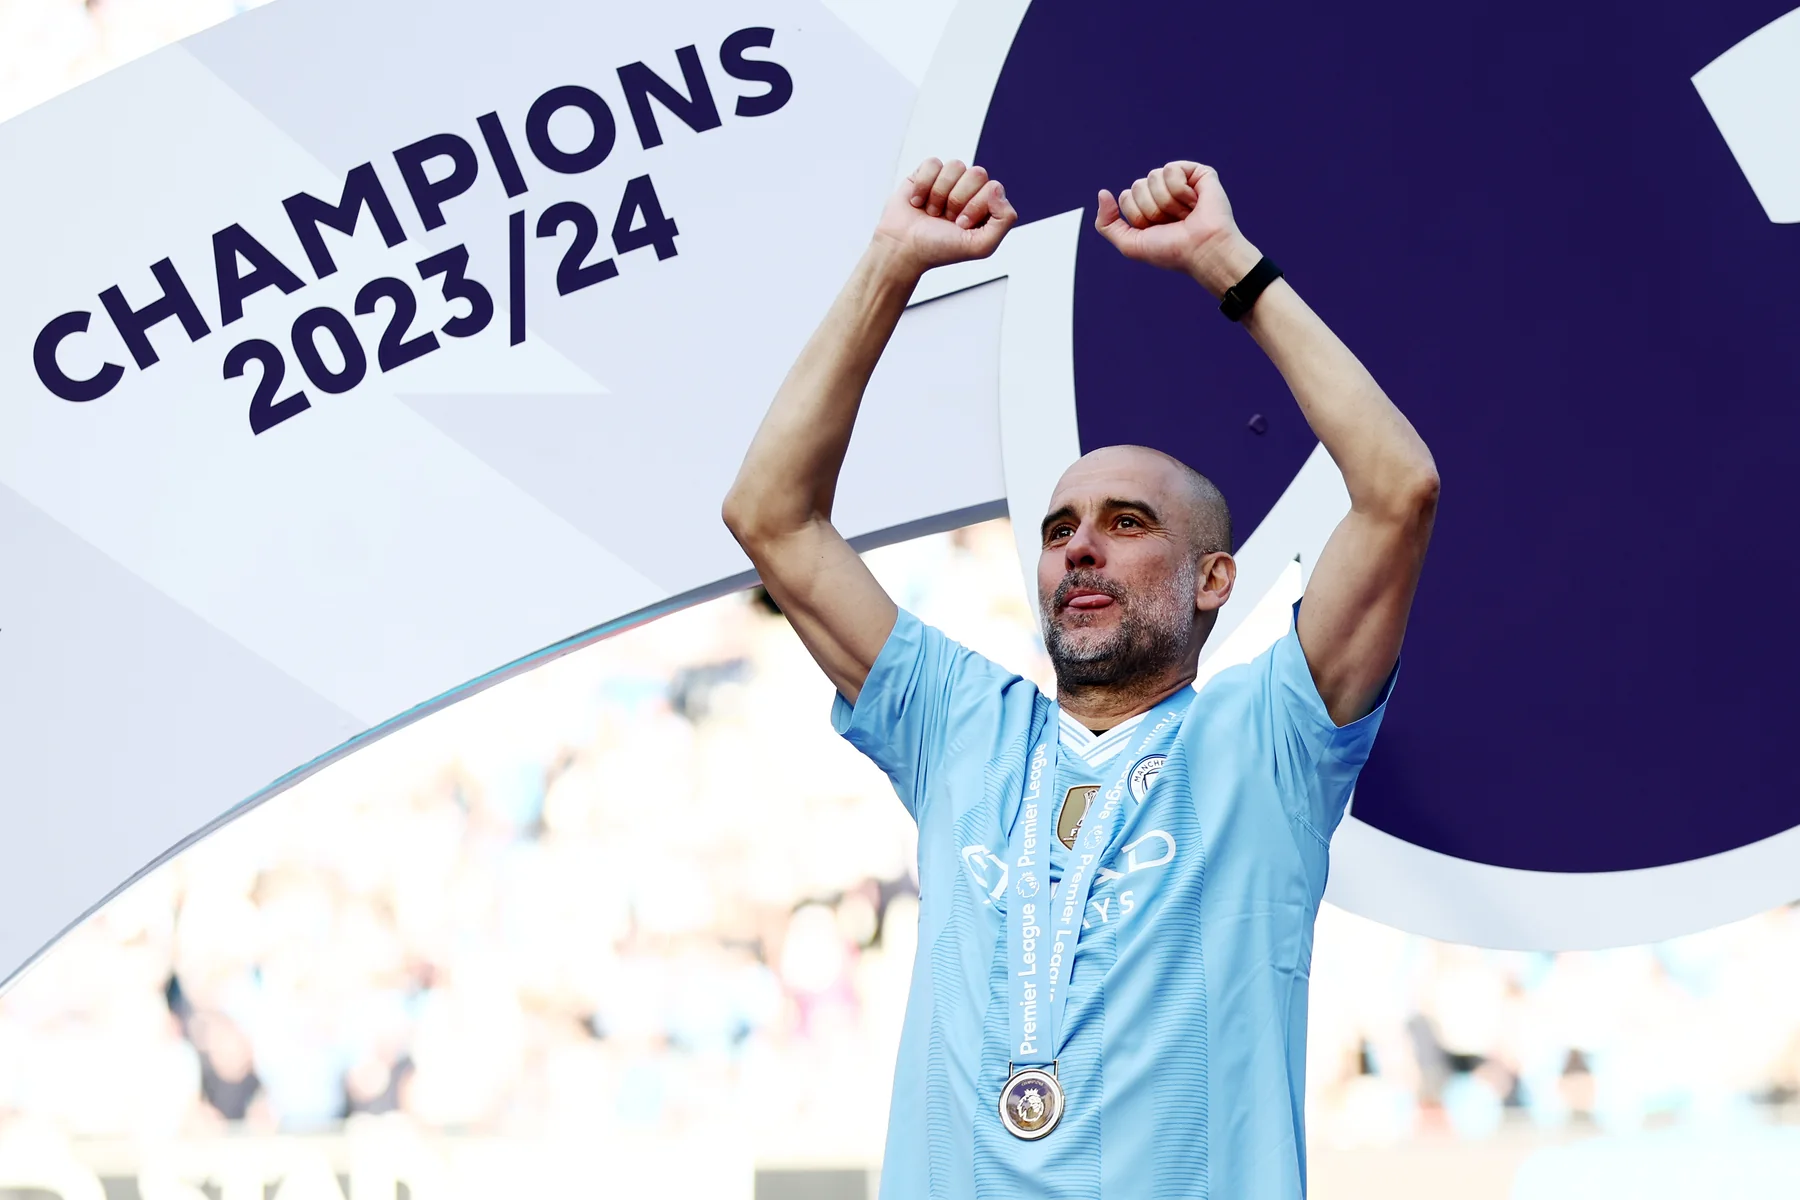
Manchester City finished the campaign as champions with 91 points, two ahead of Arsenal on 89. Tottenham finished fifth on 66. Those outcomes do not make the October table wrong; they describe what happened over the remaining 28 matches. Spurs' early lead was a real achievement at a real moment, while City's completed record was the one that ultimately decided the championship.
| Club | Ten-game position | Ten-game points | Final position | Final points |
|---|---|---|---|---|
| Tottenham Hotspur | 1 | 26 | 5 | 66 |
| Arsenal | 2 | 24 | 2 | 89 |
| Manchester City | 3 | 24 | 1 | 91 |
| Liverpool | 4 | 23 | 3 | 82 |
| Aston Villa | 5 | 22 | 4 | 68 |
| Chelsea | 11 | 12 | 6 | 63 |
Subtracting the early totals makes the contrast clearer. City collected another 67 points, Arsenal another 65 and Tottenham another 40. Those are returns over the same number of remaining league matches, not different-sized samples. They explain how two clubs starting behind Spurs finished above them. They do not, on their own, establish a single cause for the change: the table records results rather than isolating the effect of tactics, injuries or any one fixture.
The movement was not confined to first place. Liverpool moved from fourth to third and Villa from fifth to fourth. Chelsea rose from eleventh to sixth, ending with 63 points after their final-day win against Bournemouth. A position in the lower half after ten games was therefore not an immovable ceiling. For the full twenty-club outcome, the 2023/24 final table keeps that completed record separate from this early comparison.
Some early concerns did persist: Luton, Burnley and Sheffield United eventually occupied the relegation places. But that confirmation came through the rest of the season, rather than being automatically settled in October. The useful lesson is neither that ten games reveal everything nor that they reveal nothing. They establish points already earned and an initial gap; the final standings establish what all 38 matches and the decisions applying by season end produced.
How to read this historical table without mixing dates
A round number is not always the same as the number of matches a club has played. Postponements can leave games in hand or bring an earlier round's fixture into a later month. In 2023/24, Luton against Burnley was postponed from August and played on 3 October. By this page's cutoff both clubs had caught up, and every team had ten appearances. That equality needs to be checked, rather than assumed simply because the schedule says Matchweek 10.
- Read the season label. “2023” alone can refer to 2022/23, 2023/24 or a calendar-year comparison.
- Fix the cutoff. A Friday table and the completed weekend can show different leads.
- Check games played. Ten rounds on the calendar do not guarantee ten appearances for every club.
- Read the points notes. A later deduction or appeal belongs to its effective date.
- Check the module itself. An old article date does not guarantee that an embedded table remained frozen.
The last point is particularly important. The Premier League's title-race analysis published on 1 November 2023 describes Tottenham's 26-point start in its prose, but its embedded table now displays 38 games and final totals. Both pieces of information have an identifiable context; only one describes the ten-game moment. If the P column says 38, it cannot be the requested October snapshot, however well the surrounding headline matches your search.
Different historical tables can therefore be valid without being interchangeable. A table immediately after Spurs' Friday win answers a different question from the one after City's Sunday result. A final table incorporates the whole campaign and the administrative decisions applying by its conclusion. Compare points, remaining matches and any deduction notes at one shared cutoff. Otherwise a seemingly small change of date can create a misleading claim about a lead, a relegation gap or a club's progress.
For today's matches, use the current results tool and current Premier League table. For this historical question, keep the season, date and ten-game count attached to the figures above. That gives you a stable reference for what had happened by October 2023, while the separate final-table comparison shows how the rest of the campaign changed the order.
Comments
Ask a useful question or share a helpful tip. Comments are reviewed before publication.
Loading comments…