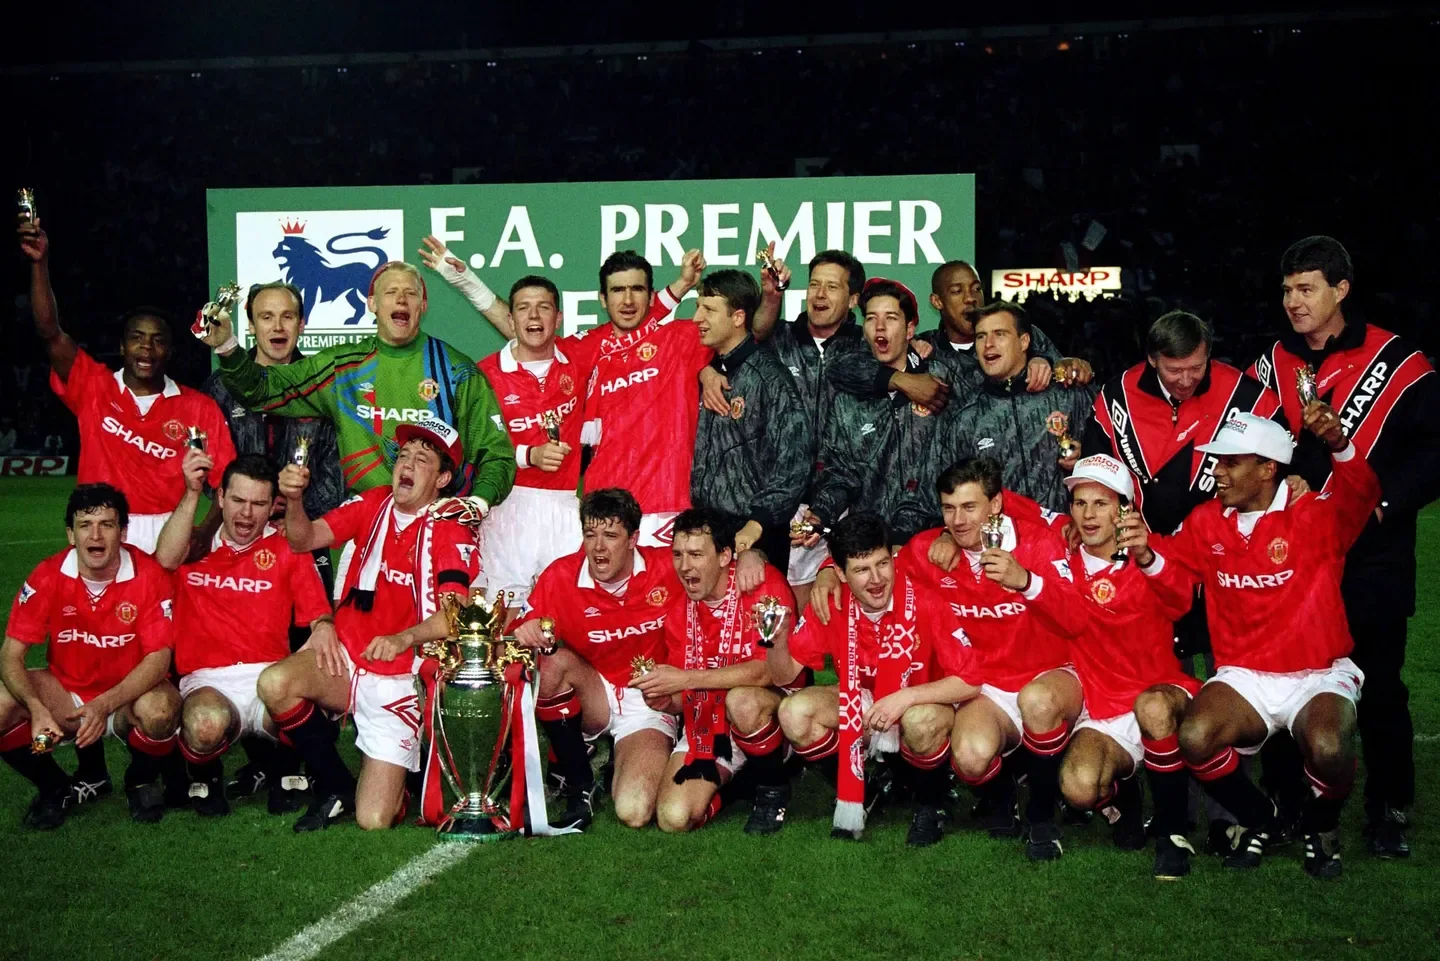
The first Premier League season was 1992/93, and Manchester United finished top of its 22-team table with 84 points. Aston Villa were second with 74 and Norwich City third with 72. Every club played 42 league matches, so this is a longer campaign than the 38-game seasons familiar to supporters today.
Below is the complete final table, followed by the details that make its rows easier to understand: the extra fixtures, Norwich's negative goal difference, and Crystal Palace's relegation despite collecting 49 points. These are completed historical standings. For an ongoing campaign, use the current Premier League table and keep its season label separate from this inaugural competition.
The complete first Premier League table: 1992/93
This is the final league table after all 462 fixtures had been completed, rather than a snapshot from the title run-in. It includes every inaugural member, from the champions to Nottingham Forest in 22nd. The positions and totals match the historical table in the Premier League's official handbook. The three relegated clubs are marked so the survival boundary remains clear without relying on colours.
| Pos | Club | P | W | D | L | GF | GA | GD | Pts |
|---|---|---|---|---|---|---|---|---|---|
| 1 | Manchester United | 42 | 24 | 12 | 6 | 67 | 31 | 36 | 84 |
| 2 | Aston Villa | 42 | 21 | 11 | 10 | 57 | 40 | 17 | 74 |
| 3 | Norwich City | 42 | 21 | 9 | 12 | 61 | 65 | -4 | 72 |
| 4 | Blackburn Rovers | 42 | 20 | 11 | 11 | 68 | 46 | 22 | 71 |
| 5 | Queens Park Rangers | 42 | 17 | 12 | 13 | 63 | 55 | 8 | 63 |
| 6 | Liverpool | 42 | 16 | 11 | 15 | 62 | 55 | 7 | 59 |
| 7 | Sheffield Wednesday | 42 | 15 | 14 | 13 | 55 | 51 | 4 | 59 |
| 8 | Tottenham Hotspur | 42 | 16 | 11 | 15 | 60 | 66 | -6 | 59 |
| 9 | Manchester City | 42 | 15 | 12 | 15 | 56 | 51 | 5 | 57 |
| 10 | Arsenal | 42 | 15 | 11 | 16 | 40 | 38 | 2 | 56 |
| 11 | Chelsea | 42 | 14 | 14 | 14 | 51 | 54 | -3 | 56 |
| 12 | Wimbledon | 42 | 14 | 12 | 16 | 56 | 55 | 1 | 54 |
| 13 | Everton | 42 | 15 | 8 | 19 | 53 | 55 | -2 | 53 |
| 14 | Sheffield United | 42 | 14 | 10 | 18 | 54 | 53 | 1 | 52 |
| 15 | Coventry City | 42 | 13 | 13 | 16 | 52 | 57 | -5 | 52 |
| 16 | Ipswich Town | 42 | 12 | 16 | 14 | 50 | 55 | -5 | 52 |
| 17 | Leeds United | 42 | 12 | 15 | 15 | 57 | 62 | -5 | 51 |
| 18 | Southampton | 42 | 13 | 11 | 18 | 54 | 61 | -7 | 50 |
| 19 | Oldham Athletic | 42 | 13 | 10 | 19 | 63 | 74 | -11 | 49 |
| 20 | Crystal Palace (R) | 42 | 11 | 16 | 15 | 48 | 61 | -13 | 49 |
| 21 | Middlesbrough (R) | 42 | 11 | 11 | 20 | 54 | 75 | -21 | 44 |
| 22 | Nottingham Forest (R) | 42 | 10 | 10 | 22 | 41 | 62 | -21 | 40 |
P means played; W, D and L are wins, draws and defeats; GF and GA are goals scored and conceded. Goal difference is GF minus GA, while points are three for each win and one for each draw. United's 24 wins and 12 draws therefore produce 84 points. Equal points do not necessarily mean equal positions: Liverpool, Sheffield Wednesday and Tottenham all finished with 59, but their goal differences were +7, +4 and -6. Coventry and Ipswich even shared 52 points and a -5 difference; Coventry's 52 goals scored put them above Ipswich's 50.
Read the club names as a record of this particular season. Queens Park Rangers finished fifth and above every other London club; Arsenal were tenth and Chelsea eleventh. Those placings are not adjusted to reflect later success or today's division membership. Keeping all 22 rows also preserves the narrow margins near the bottom: Southampton had only one point more than Oldham and Palace, despite occupying a different place in the survival story. A top-ten extract would hide much of what makes this first table significant.
Why every club played 42 matches
A 22-club league gives each team 21 opponents. Playing each opponent at home and away produces 42 matches per club: 21 at home and 21 away. The P42 column is therefore correct. It does not include FA Cup ties or an extra playoff round, and it is not a data-entry error caused by an old website. The first season used the same basic home-and-away principle as the modern league, with two more clubs taking part.
Across the whole competition, 22 multiplied by 42 gives 924 team appearances. Divide by two because every fixture involves two clubs, and the actual match total is 462. A modern season contains 380, which means the inaugural calendar had 82 more league fixtures overall. That difference matters when comparing scoring totals or the number of opportunities to collect points. It also explains why counting every match on every team's list without dividing by two produces the wrong competition total. Our 38-game and 380-fixture guide sets out the modern calculation.
The reduction did not happen immediately after the first campaign. There were 22 clubs in 1992/93, 1993/94 and 1994/95. At the end of 1994/95, four went down and only two came up, leaving 20 for 1995/96. That is the point at which the familiar 38-match club schedule began. When a historical comparison groups every Premier League season together, checking the season's format should come before interpreting the totals.
Comparing 84 points with a modern 38-game season
United earned exactly two points per match: 84 divided by 42. Maintaining that rate for 38 matches would produce 76 points. This is a comparison of rates, not a revised title-winning total. The actual champions earned 84 and finished ten ahead of Villa. The calculation simply shows why an early Premier League points total cannot be placed beside a modern one without acknowledging the extra four opportunities to score points.
The same caution applies near the bottom. Palace's 49 points came from 42 fixtures, a rate of about 1.17 per match. Multiplied by 38, that rate becomes roughly 44.3 points. It does not prove Palace would have stayed up in a shorter season: changing the calendar would also change opponents, results and every other team's opportunities. It does show why a remembered modern survival target is a poor guide to interpreting the 1993 table.
Use points per match when the question concerns the pace of accumulation, and use final position when it concerns the actual achievement. Those measures describe different things. United won their competition under its rules, while Palace finished below the survival line under the same rules. No numerical adjustment changes either outcome. A useful historical comparison keeps the original played column visible, labels any derived rate, and avoids presenting a proportional calculation as a second official table.
How Manchester United won the inaugural title
Manchester United's first Premier League championship ended a 26-year wait for a top-flight title. The final ten-point lead over Aston Villa looks comfortable, but it should not be mistaken for a campaign spent permanently in front. United recovered from a poor opening, and Eric Cantona's arrival from Leeds late in 1992 became an important part of that revival. Their strongest finish ultimately separated them from the other challengers: United won their final seven league matches, whereas Villa lost their last three.
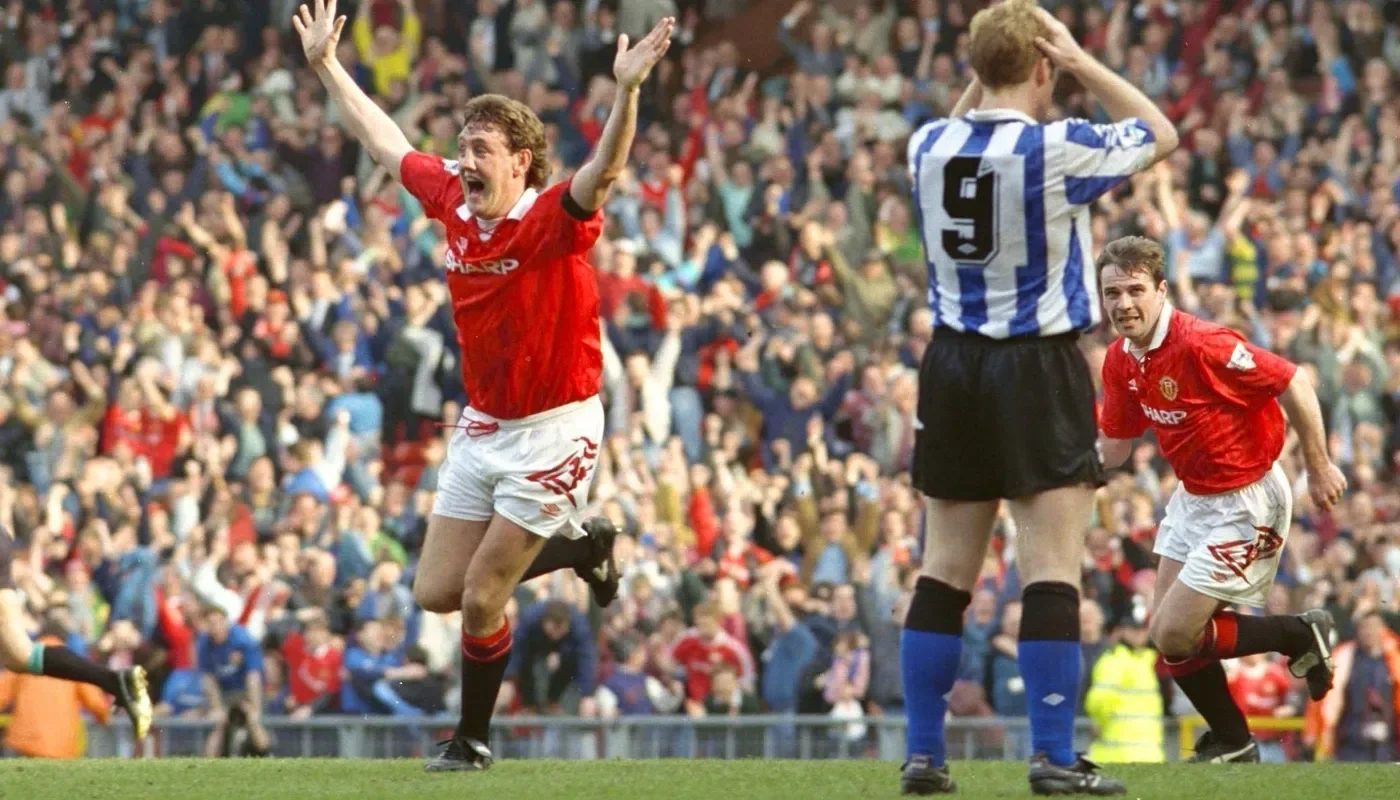
Steve Bruce's two late goals in the 2-1 home win over Sheffield Wednesday on 10 April were a major turning point, not the mathematical title-clinching moment. That arrived on 2 May 1993, when Villa lost 1-0 at home to Oldham and could no longer catch United. The league's title-deciding chronology makes this distinction clear. United's 3-1 victory over Blackburn the next day was played with the championship already secured. Separating the famous match, the decisive rival result and the celebration prevents three different events becoming one misleading date.
Why Norwich finished third with a negative goal difference
Norwich's row is perfectly consistent: 21 wins were worth 63 points and nine draws supplied another nine, making 72. Their 61 goals scored and 65 conceded produced a -4 goal difference. Points determined the finishing order before goal difference was needed to separate teams level on points. Because Norwich finished a point ahead of Blackburn, their inferior goal difference did not remove third place. Looking at the scoring columns alone would answer a different question from the one used to rank the league.
A heavy defeat can damage goal difference dramatically, but it still costs only the three points available for that match. Conversely, several narrow victories can add many points while improving the difference only a little. That arithmetic explains how the apparently strange combination is possible without suggesting that Norwich's third place was an administrative exception. The final numbers tell us they accumulated more points than 19 other clubs, while conceding more goals than they scored across all their fixtures.
The neighbouring rows make the distinction especially clear. Villa also won 21 matches but drew 11 rather than nine, which gave them 74 points. Blackburn scored a league-high 68 goals and had a +22 difference, yet their 20 wins and 11 draws yielded 71 points. Neither scoring more nor having the more attractive difference automatically produced the higher place. Norwich's campaign is useful precisely because it encourages readers to inspect wins and draws before trying to explain a table entirely through goals.
The relegation battle: how 49 points sent Palace down
Crystal Palace, Middlesbrough and Nottingham Forest occupied the bottom three positions and were relegated. Palace's 49 points matched Oldham's total, but their -13 goal difference was worse than Oldham's -11. There was no fixed points threshold guaranteeing survival; finishing above the relegation places was what mattered. Nor should readers draw the line after 17th, as they would in a 20-team league. In this 22-team competition, 19th was the final safe position, and that was the place Oldham secured.
The final-day combination explains the reversal. Oldham beat Southampton 4-3, gaining three points and improving their goal difference by one. Palace lost 3-0 at Arsenal, adding no points and reducing their difference by three. Working backwards from the final table, Palace had entered those matches on -10 and Oldham on -12; by the finish the order had flipped. The margins of victory and defeat therefore mattered alongside the basic win-and-loss outcomes. The club's account of Palace's following season recalls the painful relegation that preceded their immediate promotion campaign.
The rest of the lower half shows how closely packed the competition was. Southampton finished on 50 points, Leeds on 51, and Sheffield United, Coventry and Ipswich on 52. A relatively small points difference separated those places from Palace in 20th. Middlesbrough's 44 and Forest's 40 left them further adrift, but Palace's fate required the last results and the tiebreak. For supporters comparing relegation campaigns across eras, retaining the league size, number of matches and actual survival position is more informative than repeating the points total on its own.
How the Premier League began and how to check its history
For another look at the archive, open the official 1992/93 table and check both the season and the selected stage of the campaign. A midseason snapshot can be historically correct while showing a different leader and unequal played totals. For the completed first season, look for 22 clubs, P42 throughout, and United on 84. Those three checks quickly identify whether you have reached the final table rather than a dated image shared without context.
A date-based archive is useful when the question is who led at Christmas or before a particular match; the final table answers where everybody finished. Keep that distinction when moving between eras. Our 2020/21 to 2024/25 final tables provide separate season views for more recent comparisons. They should not be merged with the inaugural season or mistaken for a combined multi-year ranking. The label above the table is part of the data, especially when an old page resembles a modern live standings screen.
The founding date and first match date are different
The Premier League's formation involved several milestones. The Founder Members Agreement was signed on 17 July 1991, setting out the new league's principles. The First Division clubs resigned from the Football League on 20 February 1992, and the Premier League was established as a limited company on 27 May 1992. The first fixtures followed on 15 August 1992. That is why a question about when the league was founded can produce a different date from a question about when its first season began. The official origins account separates those events.
English top-flight football itself did not begin in 1992. The Premier League replaced the old First Division at the top of the existing football structure, with a new commercial organisation able to arrange its own broadcasting and sponsorship agreements. Leeds entered the opening campaign as the reigning English league champions, despite no Premier League championship having yet been awarded. That continuity matters when describing United's success: it was their first Premier League title, but it also ended a long wait for the broader English top-flight honour.
The first goal and the first Golden Boot
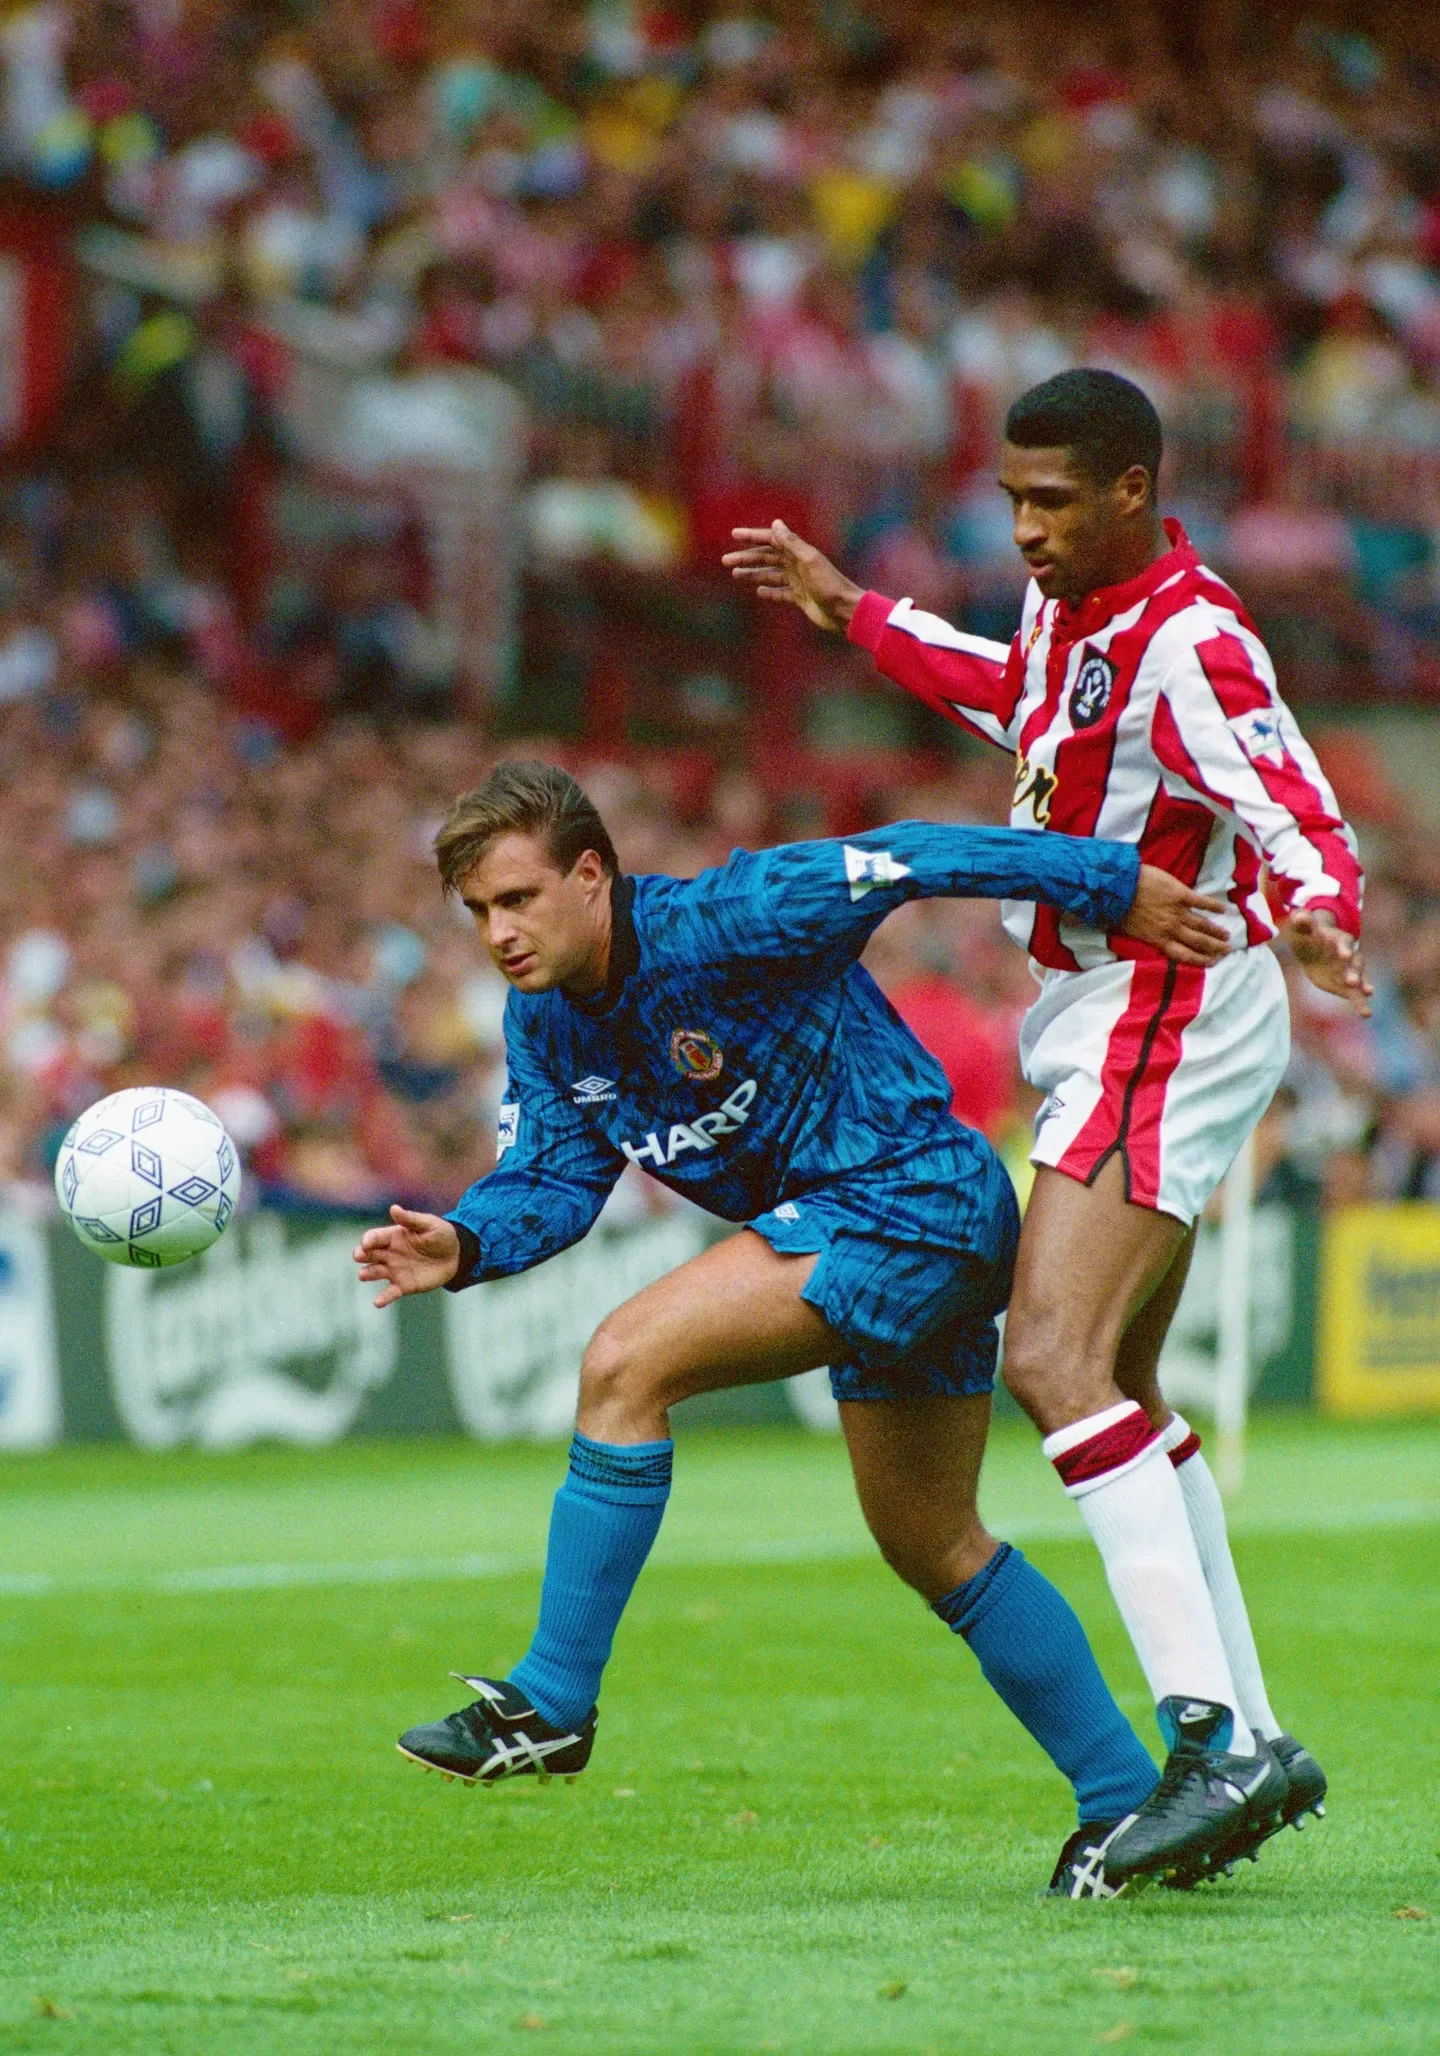
Brian Deane scored the competition's first goal for Sheffield United against Manchester United on 15 August 1992. The hosts won 2-1, a reminder that the eventual champions' campaign began with defeat. Teddy Sheringham supplied another first the following day: the only goal in Nottingham Forest's 1-0 victory over Liverpool was the first scored in a live televised Premier League match. Deane's milestone belongs to the whole competition; Sheringham's belongs to its live television coverage. They are distinct records rather than competing versions of the same event.
Sheringham also finished as the inaugural Golden Boot winner with 22 league goals, accumulated across Nottingham Forest and Tottenham after his early-season transfer. His Forest goal was followed by 21 for Spurs. That combined total is important: checking only Tottenham's player statistics would miss part of the winning campaign. It is also a useful season check when consulting historical summaries. A scorer list must therefore show the season-wide total across both clubs to explain the award correctly.
The table and these firsts answer complementary supporter questions. United's place identifies the first champion, Deane's opening-day goal identifies the first scorer, and Sheringham's season total identifies the first leading scorer. None requires changing the competition filter to include cup football or changing the table to match today's format. When sharing an archive image or a statistic, include the season, whether it describes a final position or an individual record, and the fact that the clubs played 42 league matches. Those details preserve the meaning of the numbers.
Comments
Ask a useful question or share a helpful tip. Comments are reviewed before publication.
Loading comments…