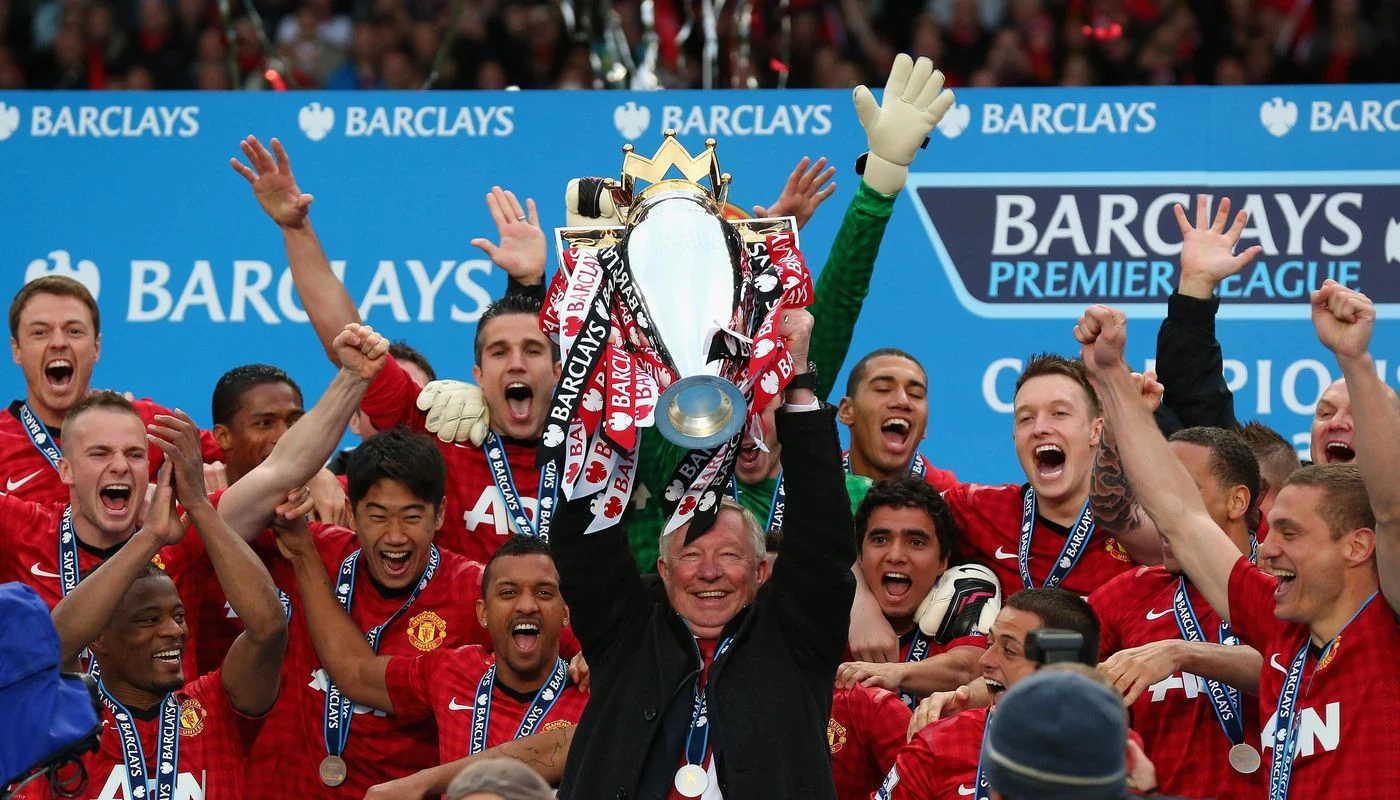
Manchester United lead the all-time Premier League table through the end of 2025/26. The complete ranking below includes all 51 clubs that played in the competition across its first 34 completed seasons, beginning in 1992/93. It uses final, deduction-adjusted league points and stops before 2026/27, so the numbers remain comparable even while a new title race develops.
An all-time table answers a different question from the current Premier League standings. It measures accumulated performance against every league opponent over many years. It also rewards time spent in the division. Read the points column alongside games played and points per game, then use the explanations below to distinguish a club's overall record from its trophy count, recent form and longer English football history.
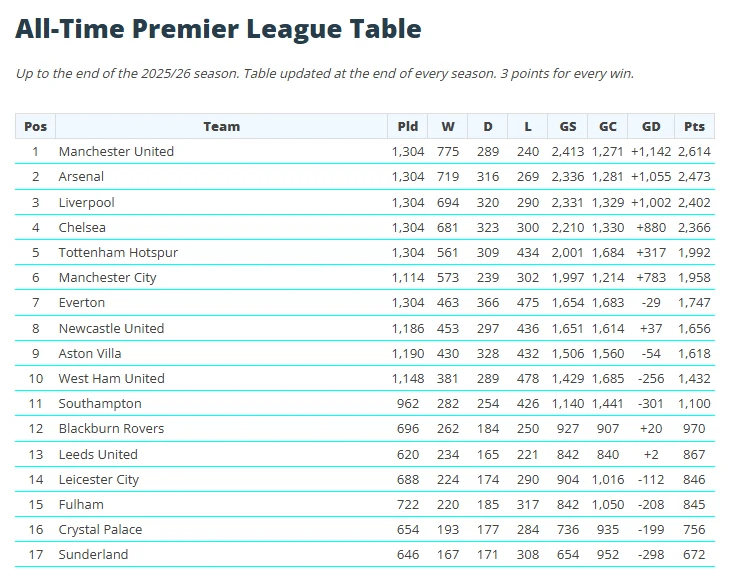
The complete all-time Premier League table through 2025/26
This table covers 1992/93 to 2025/26, ending on 24 May 2026. All 13,166 completed fixtures in those seasons contribute to the records below. P means played, W wins, D draws, L losses and GD goal difference. Points include finalized deductions from the included seasons; PPG is that adjusted points total divided by matches played, rounded to three decimal places. Every club appears once, including those currently outside the Premier League.
| Rank | Club | P | W | D | L | GD | Points | PPG |
|---|---|---|---|---|---|---|---|---|
| 1 | Manchester United | 1304 | 775 | 289 | 240 | +1142 | 2614 | 2.005 |
| 2 | Arsenal | 1304 | 719 | 316 | 269 | +1055 | 2473 | 1.896 |
| 3 | Liverpool | 1304 | 694 | 320 | 290 | +1002 | 2402 | 1.842 |
| 4 | Chelsea | 1304 | 681 | 323 | 300 | +880 | 2366 | 1.814 |
| 5 | Tottenham Hotspur | 1304 | 561 | 309 | 434 | +317 | 1992 | 1.528 |
| 6 | Manchester City | 1114 | 573 | 239 | 302 | +783 | 1958 | 1.758 |
| 7 | Everton | 1304 | 463 | 366 | 475 | -29 | 1747 | 1.340 |
| 8 | Newcastle United | 1186 | 453 | 297 | 436 | +37 | 1656 | 1.396 |
| 9 | Aston Villa | 1190 | 430 | 328 | 432 | -54 | 1618 | 1.360 |
| 10 | West Ham United | 1148 | 381 | 289 | 478 | -256 | 1432 | 1.247 |
| 11 | Southampton | 962 | 282 | 254 | 426 | -301 | 1100 | 1.143 |
| 12 | Blackburn Rovers | 696 | 262 | 184 | 250 | +20 | 970 | 1.394 |
| 13 | Leeds United | 620 | 234 | 165 | 221 | +2 | 867 | 1.398 |
| 14 | Leicester City | 688 | 224 | 174 | 290 | -112 | 846 | 1.230 |
| 15 | Fulham | 722 | 220 | 185 | 317 | -208 | 845 | 1.170 |
| 16 | Crystal Palace | 654 | 193 | 177 | 284 | -199 | 756 | 1.156 |
| 17 | Sunderland | 646 | 167 | 171 | 308 | -298 | 672 | 1.040 |
| 18 | Middlesbrough | 574 | 165 | 169 | 240 | -146 | 661 | 1.152 |
| 19 | Bolton Wanderers | 494 | 149 | 128 | 217 | -170 | 575 | 1.164 |
| 20 | Wolverhampton Wanderers | 456 | 129 | 110 | 217 | -232 | 497 | 1.090 |
| 21 | West Bromwich Albion | 494 | 117 | 139 | 238 | -262 | 490 | 0.992 |
| 22 | Stoke City | 380 | 116 | 109 | 155 | -127 | 457 | 1.203 |
| 23 | Brighton & Hove Albion | 342 | 108 | 109 | 125 | -43 | 433 | 1.266 |
| 24 | Nottingham Forest | 350 | 108 | 98 | 144 | -97 | 418 | 1.194 |
| 25 | AFC Bournemouth | 342 | 108 | 87 | 147 | -120 | 411 | 1.202 |
| 26 | Coventry City | 354 | 99 | 112 | 143 | -103 | 409 | 1.155 |
| 27 | Norwich City | 392 | 99 | 105 | 188 | -255 | 402 | 1.026 |
| 28 | Sheffield Wednesday | 316 | 101 | 89 | 126 | -44 | 392 | 1.241 |
| 29 | Wimbledon | 316 | 99 | 94 | 123 | -88 | 391 | 1.237 |
| 30 | Burnley | 380 | 92 | 95 | 193 | -229 | 371 | 0.976 |
| 31 | Charlton Athletic | 304 | 93 | 82 | 129 | -100 | 361 | 1.188 |
| 32 | Wigan Athletic | 304 | 85 | 76 | 143 | -166 | 331 | 1.089 |
| 33 | Swansea City | 266 | 82 | 66 | 118 | -77 | 312 | 1.173 |
| 34 | Queens Park Rangers | 278 | 81 | 65 | 132 | -92 | 308 | 1.108 |
| 35 | Birmingham City | 266 | 73 | 82 | 111 | -87 | 301 | 1.132 |
| 36 | Portsmouth | 266 | 79 | 65 | 122 | -88 | 293 | 1.102 |
| 37 | Watford | 304 | 73 | 66 | 165 | -208 | 285 | 0.938 |
| 38 | Derby County | 266 | 68 | 70 | 128 | -149 | 274 | 1.030 |
| 39 | Brentford | 190 | 68 | 49 | 73 | +7 | 253 | 1.332 |
| 40 | Ipswich Town | 240 | 61 | 63 | 116 | -139 | 246 | 1.025 |
| 41 | Sheffield United | 236 | 56 | 57 | 123 | -152 | 225 | 0.953 |
| 42 | Hull City | 190 | 41 | 48 | 101 | -142 | 171 | 0.900 |
| 43 | Reading | 114 | 32 | 23 | 59 | -50 | 119 | 1.044 |
| 44 | Oldham Athletic | 84 | 22 | 23 | 39 | -37 | 89 | 1.060 |
| 45 | Cardiff City | 76 | 17 | 13 | 46 | -77 | 64 | 0.842 |
| 46 | Bradford City | 76 | 14 | 20 | 42 | -70 | 62 | 0.816 |
| 47 | Huddersfield Town | 76 | 12 | 17 | 47 | -84 | 53 | 0.697 |
| 48 | Blackpool | 38 | 10 | 9 | 19 | -23 | 39 | 1.026 |
| 49 | Barnsley | 38 | 10 | 5 | 23 | -45 | 35 | 0.921 |
| 50 | Swindon Town | 42 | 5 | 15 | 22 | -53 | 30 | 0.714 |
| 51 | Luton Town | 38 | 6 | 8 | 24 | -33 | 26 | 0.684 |
United's 2,614 points put them 141 ahead of Arsenal's 2,473 at this endpoint. Both clubs played 1,304 matches, so that particular comparison combines the same number of opportunities with different results. Liverpool and Chelsea follow, also with 1,304 games. Their positions describe an accumulated league record across more than three decades. They do not identify the strongest squad this weekend, and the points gap should not be treated as a forecast for the season currently being played.
The lower half needs a different reading. Brentford accumulated 253 points from 190 matches, whereas several clubs above them played many more seasons in the division. A club does not collect Premier League points while competing in the Championship, and those absent years do not add matches to its denominator. Conversely, a brief appearance can leave a permanent place in the archive: Swindon Town's 42 games belong to the early 22-club format, while Luton Town's 38 come from one modern campaign. Keeping every participant visible makes the ranking useful beyond a familiar group of leading clubs.
How this all-time Premier League table is calculated
The starting rule is straightforward: a win earns three points, a draw earns one and a defeat earns none. For each club, add every included Premier League result across its seasons in the division. A fixture contributes one appearance to each participant’s record, but it is never counted twice for the same club. Home and away performances both belong in the overall total.
The final formula here is points = three times wins, plus draws, minus finalized points deductions. That last step makes this a sum of adjusted competition points rather than an unqualified measure of results earned on the pitch. Wins, draws, losses and goals remain the actual match record. FA Cup ties, European matches, friendlies and games in other divisions contribute nothing to any column in this table.
What changes when points deductions are included?
A deduction changes competition points without turning a win into a loss or removing a match from the record. Everton provide a useful check: 463 wins and 366 draws produce 1,755 points before sanctions. Their eight-point deduction in 2023/24 reduces the cumulative total to 1,747. That difference is an accounting boundary, not evidence that a result has gone missing. The same distinction explains the other adjusted rows below.
| Club | Season | Deduction | All-time earned points | All-time net points |
|---|---|---|---|---|
| Middlesbrough | 1996/97 | 3 | 664 | 661 |
| Portsmouth | 2009/10 | 9 | 302 | 293 |
| Everton | 2023/24 | 8 | 1755 | 1747 |
| Nottingham Forest | 2023/24 | 4 | 422 | 418 |
Use the final sanction after the relevant appeal process, rather than adding every figure reported during the case. Everton’s original ten-point penalty became six, and a separate two-point penalty remained in place, producing eight overall. Forest’s four-point deduction was upheld. A table already showing these adjusted totals must not have them subtracted again. Equally, a sanction imposed in another division does not belong in a Premier League-only calculation. This archive applies the finalized adjustments for its included seasons and makes no assumption about a future decision or an unfinished campaign.
Club names and the start of the Premier League era
Club names must be consistent before different datasets are joined. Bournemouth and AFC Bournemouth refer to one participant here; so do Wolves and Wolverhampton Wanderers, or Brighton and Brighton & Hove Albion. Treating short names as separate teams would split their records and inflate the number of clubs. The historical Wimbledon entry retains the name under which those Premier League matches were played. It is not a spare total to attach to a different modern club simply because its name looks related.
The played column also reflects a genuine format change. The first three Premier League seasons had 22 clubs, giving an ever-present team 42 fixtures per season. From 1995/96 the division had 20 clubs and 38 fixtures per club. Through 2025/26, an ever-present record therefore contains three lots of 42 plus 31 lots of 38: 1,304 matches. Applying 38 retrospectively to every year would lose 12 real games from each ever-present club’s record.
Finally, “since 1992” is a competition boundary, not a claim that English league football started then. The inaugural Premier League campaign began on 15 August 1992. Earlier First Division results remain part of each club’s history, but they belong to a longer top-flight comparison. If you want to compare champions instead of points, the Premier League winners list uses the same modern competition boundary and presents the individual winning seasons.
What the ranking tells supporters about different clubs
An accumulated points total combines two things: how often a club has been in the Premier League and how successfully it has played while there. Long membership creates opportunities, but it does not award points automatically. Everton’s ever-present status and Blackburn Rovers’ shorter record describe different paths through the competition. Neither can be understood fully by reading rank alone and ignoring the games beside it.
Tottenham and Manchester City show the distinction particularly clearly. Spurs have 1,992 points against City’s 1,958, a lead of 34. Yet Spurs played 1,304 matches to City’s 1,114, creating a difference of 190 opportunities. It is perfectly coherent for a club to rank higher on accumulated points while another has a better average return or more championships. Each measure answers its own question; the archive does not collapse them into a single verdict on club size.
Why points per game tells a different story
Points per game divides adjusted points by actual matches played. United’s calculation is 2,614 divided by 1,304, or 2.005 when rounded to three decimal places. The numerator uses the same net-points definition as the main table. The denominator includes only Premier League appearances, so a season in another division is neither credited with points nor inserted as 38 zero-return games. The comparison below takes the six leading clubs by cumulative points and orders that group by PPG.
| Club | Net points | Played | PPG |
|---|---|---|---|
| Manchester United | 2614 | 1304 | 2.005 |
| Arsenal | 2473 | 1304 | 1.896 |
| Liverpool | 2402 | 1304 | 1.842 |
| Chelsea | 2366 | 1304 | 1.814 |
| Manchester City | 1958 | 1114 | 1.758 |
| Tottenham Hotspur | 1992 | 1304 | 1.528 |
City move ahead of Tottenham in this rate comparison because their points were accumulated in fewer games. City’s 1.758 PPG exceeds Spurs’ 1.528 even though the main table correctly places Spurs above them on total points. There is no contradictory result to repair. A cumulative ranking measures the overall stock of points; a rate describes the average return per opportunity during the club’s own appearances. Keeping both columns visible prevents a rate from being mistaken for another full historical points total.
PPG still has limits. It does not adjust for the relative strength of opponents across different eras, and a short spell provides less evidence than decades of participation. A one-season club’s figure describes that particular campaign, not a tested estimate of what it would do over 34 seasons. Likewise, multiplying an old average by 38 produces a mathematical illustration, not next season’s forecast. Use the rate to understand the existing sample, retain the match count beside it, and examine recent seasons separately when the question is current performance.
All-time points are different from titles and English league history
A championship rewards finishing first in one particular season. Cumulative points reward every included result, whether the team finished first, fifth or seventeenth that year. United happen to lead both this points table and the Premier League title count, with 13 championships, but that shared leader does not make the two measurements interchangeable. A second-place season contributes all its points to this archive while contributing no championship to a winners list.
Blackburn and Leicester demonstrate why the difference matters. Both appear among the clubs that have won the Premier League, yet they sit twelfth and fourteenth respectively in this cumulative ranking. Blackburn have 970 points and Leicester 846 at the cutoff. Those totals describe every included appearance, including campaigns outside their championship peaks. A title does not add a bonus allocation to the all-time points column, and a later absence from the division does not erase the title already won. Supporters can value both achievements without expecting identical orderings.
The phrase “English league history” needs a wider boundary still. The Premier League followed the old First Division as the top tier in 1992. Earlier championships and results remain real achievements, but they cannot be inserted selectively into a table explicitly beginning in 1992/93. If one club’s earlier record is added while another’s is omitted, the comparison has changed halfway through. A full top-flight historical table needs its own complete dataset and consistent scoring convention across its longer period.
Choose the comparison that fits the discussion. Use the season-by-season Premier League champions list for championships, this archive for accumulated points, and individual season tables for the conditions of a particular campaign. Player scoring records, cup successes and European performances require their own columns or articles. Combining them into an unexplained “biggest club” score would hide the choice of weights. The useful feature of this table is that readers can see precisely what earns a place: actual Premier League results, bounded by named seasons and the stated points adjustments.
How to compare this archive with today's table
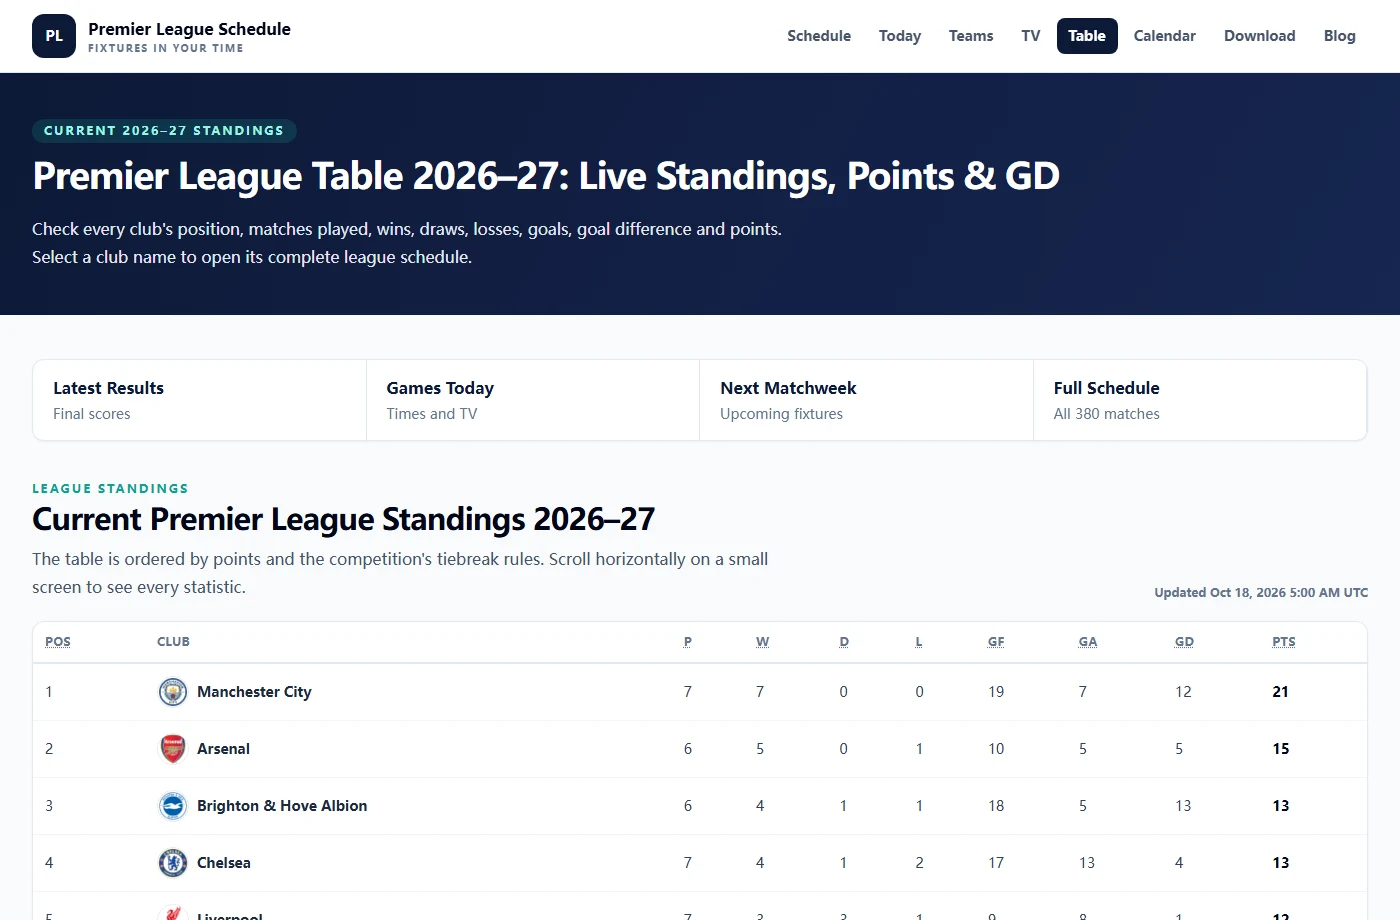
Start by checking the season label. This archive stops at the conclusion of 2025/26, while the live standings page follows the current season and displays its latest refresh time. Its points column starts again for the new campaign. A club leading that table has earned the most points in the current race, not automatically the most across the whole Premier League era. Both pages can be correct while producing completely different rankings.
- Match the date boundary. Compare two archives ending after the same completed season.
- Check the definition of points. Establish whether finalized deductions are included.
- Match the club names and played totals. Merge aliases and identify missing seasons.
- Use completed results. Add only league fixtures that actually finished within the period.
If two historical tables disagree, begin with those checks before assuming a data error. One publisher may include the latest weekend, another may update only after a full season, and another may show results-earned points before sanctions. A club absent from the present division can still rank prominently in a lifetime table. Conversely, a recently established Premier League participant can be high in today’s standings while remaining low on accumulated history. The played column usually reveals whether the tables are describing the same underlying sample.
For your own rolling calculation, add each newly completed fixture once to both participating clubs’ records and preserve a written cutoff. Do not combine a full current-season table with a separate set of results that are already inside it. Keep any confirmed points adjustment attached to the relevant campaign, so it is neither omitted nor deducted repeatedly during later updates. These checks matter most when comparing screenshots taken on different dates: the visual layout may look identical even though the number of included games has changed.
Use the archive for the historical question it solves, then move to the tool that matches your next task. The results page is appropriate for completed scores, while today’s Premier League fixtures identify the actual games scheduled for your viewing day. A lifetime points position does not supply a kickoff time, confirm a broadcaster or replace a current league table. Maintaining those separate purposes lets a fixed historical reference stay useful without pretending it updates with every whistle.
Comments
Ask a useful question or share a helpful tip. Comments are reviewed before publication.
Loading comments…