
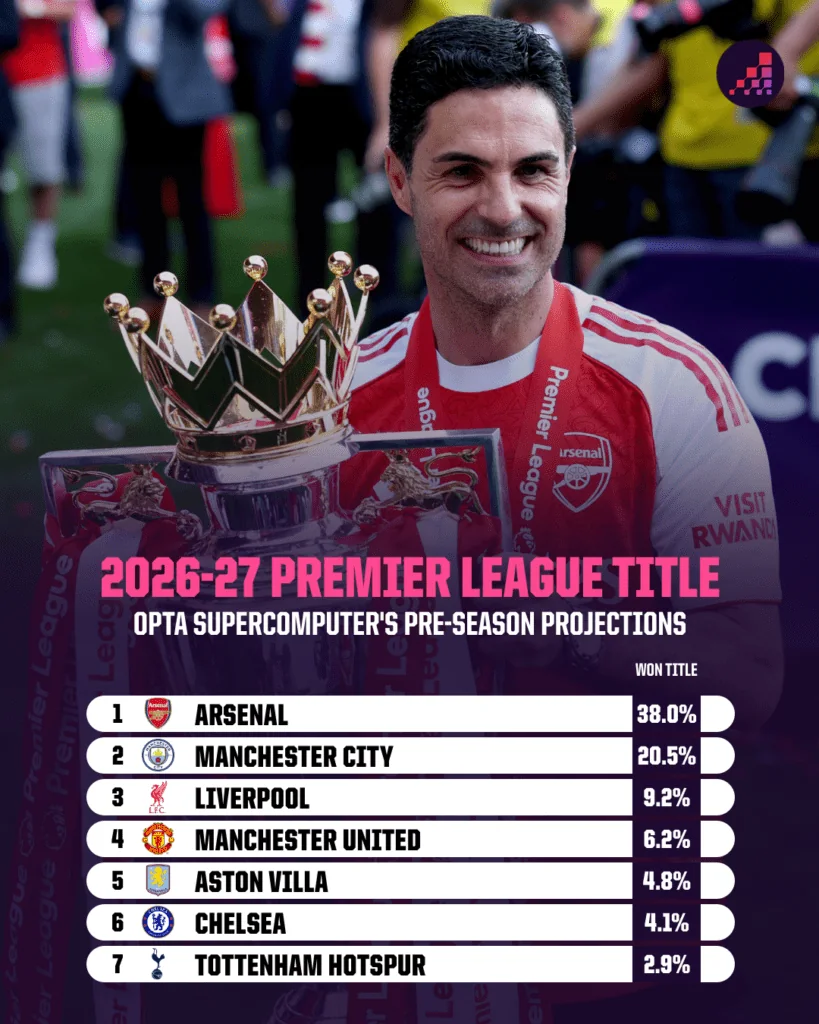
Arsenal were Opta's favourites to win the 2026/27 Premier League in its complete league-wide pre-season snapshot, taking the title in 38.0% of 10,000 simulated seasons. Manchester City followed at 20.5%. Those numbers come from simulations run on 13 August 2026; they describe how often an outcome occurred in the model, not a guaranteed winner or a final table that has already been decided.
This guide keeps that one dated snapshot intact so every club comparison is like for like. Opta also provides an updating Predicted view alongside Actual and Expected table modes, while our Premier League table tracks what has really happened. That distinction matters now the season has begun: a live projection may move after new information, but a published percentage should always retain the date of the model run behind it.
Opta's 2026/27 prediction snapshot at a glance
Opta ran 10,000 data-led simulations for its league-wide pre-season article and dated the underlying run to 13 August 2026. The published analysis then grouped the results around three supporter questions: who wins the title, who reaches the top five, and who finishes in the relegation places. Using that common baseline avoids comparing one club's later update with another club's older number.
How to read every percentage below: it is the share of simulated seasons in which that outcome occurred. A club can be the single favourite while still failing to achieve the outcome in most simulations. “Most likely” therefore means leading the field, not being promised the result.
Title probabilities from the 13 August simulation
Arsenal's 38.0% made them the clear individual favourite in Opta's baseline, but it did not make retaining the title the majority outcome. Put another way, the model produced a different champion in 62.0% of its runs. Opta's accompanying analysis pointed to the champions' continuity while many rivals were changing managers, yet the percentage itself already incorporates uncertainty: a strong starting position is not the same thing as a forecast above 50%.
| Club | Title probability |
|---|---|
| Arsenal | 38.0% |
| Manchester City | 20.5% |
| Liverpool | 9.2% |
| Manchester United | 6.2% |
| Aston Villa | 4.8% |
| Chelsea | 4.1% |
| Tottenham Hotspur | 2.9% |
Arsenal and Manchester City accounted for 58.5% of the simulated champions between them. Liverpool were third but below one chance in ten, and none of the other explicitly listed contenders reached 10%. This is also where timestamp discipline becomes essential: an Opta Manchester City article using simulations run on 20 August later showed Arsenal at 40.6% and City at 19.6%. Those are valid later values, but inserting them into the 13 August table would create a dataset Opta never published.
These figures should also stay separate from our own Premier League 2026/27 predicted table. That page is an editorial 1–20 forecast, designed to express one reasoned ordering. Opta's percentages describe thousands of possible seasons. Readers can compare the two approaches, but neither the wording nor the numbers should be passed off as the other publisher's work.
The top-five race is wider than the title race
The model found much more congestion around fifth place than at the top of the title chart. Arsenal and Manchester City were the only clubs to finish in the top five in more than half of the 13 August simulations. Liverpool sat just below that threshold at 48.6%, while six more teams landed between 21.5% and 40.0%. The distribution therefore describes a crowded chase, not five clubs already pencilled into European places.
| Club | Top-five probability |
|---|---|
| Arsenal | 83.0% |
| Manchester City | 69.4% |
| Liverpool | 48.6% |
| Manchester United | 40.0% |
| Aston Villa | 33.8% |
| Chelsea | 30.3% |
| Newcastle United | 26.2% |
| Tottenham Hotspur | 24.1% |
| Brighton & Hove Albion | 21.5% |
A top-five probability is not automatically a Champions League qualification probability. Opta's later Chelsea and Aston Villa club previews explicitly treated a fifth English place as conditional: England would first have to earn an additional performance spot through its clubs' results in UEFA competition. Until that condition is met, the safe description is “top five.” Follow the actual Premier League standings separately, and do not turn the model's threshold into a confirmed allocation for 2027/28.
Opta's 2026/27 relegation probabilities
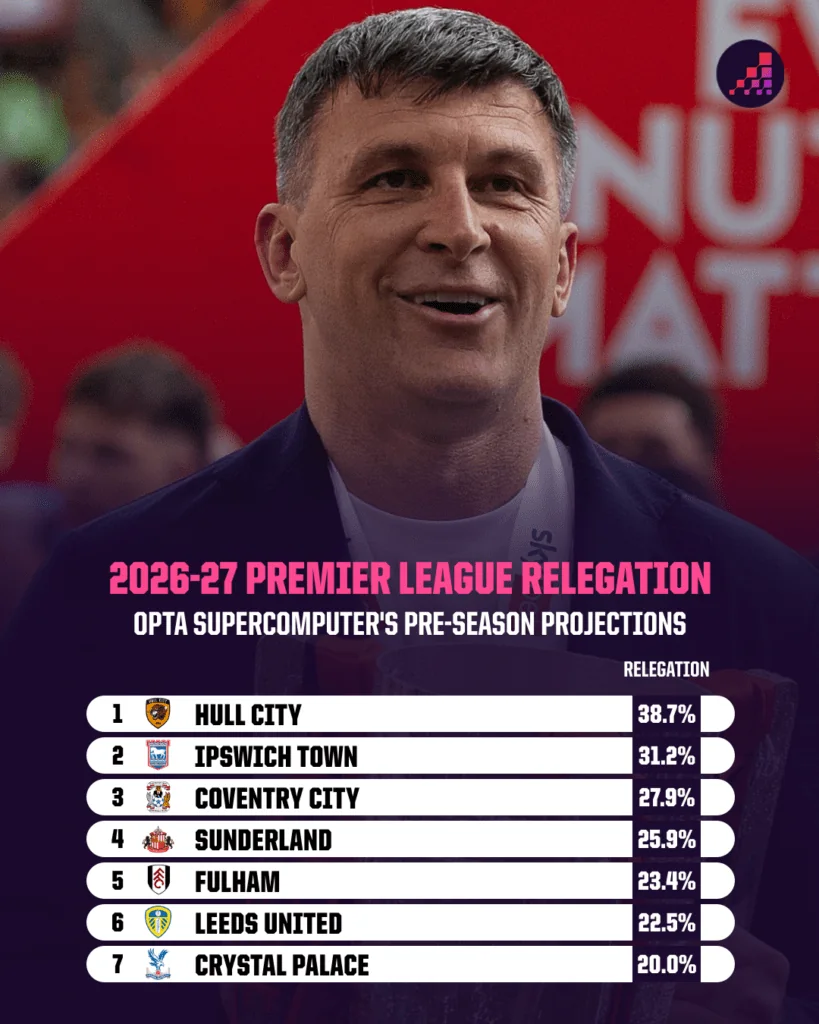
The three promoted clubs carried the highest relegation probabilities in Opta's 13 August baseline: Hull City at 38.7%, Ipswich Town at 31.2% and Coventry City at 27.9%. Even that ordering needs careful language. Hull were the model's biggest relegation risk, but they still survived in 61.3% of simulations. None of the named clubs below was more likely than not to go down.
| Club | Relegation probability |
|---|---|
| Hull City | 38.7% |
| Ipswich Town | 31.2% |
| Coventry City | 27.9% |
| Sunderland | 25.9% |
| Fulham | 23.4% |
| Leeds United | 22.5% in graphic; 23.4% in article text |
| Crystal Palace | 20.0% |
| Nottingham Forest | 18.1% |
| Brentford | 16.3% |
| Everton | 13.6% |
| AFC Bournemouth | 13.1% |
There is one source inconsistency worth exposing rather than smoothing over. Opta's article body gives Leeds a 23.4% risk, while the data graphic embedded on the same page displays 22.5%; a secondary reproduction follows the body-copy number. Both official presentations are therefore shown in the table. Opta also noted difficult opening schedules for Coventry and Hull in separate fixture analysis. That helps explain what supporters may watch, but it does not prove why the model assigned any exact percentage.
The tail of the distribution matters too. In the same league-wide run, every club other than Arsenal and Manchester City was relegated in at least 2% of simulated seasons. That does not make every side a realistic equal candidate; it shows the model retains routes to unlikely outcomes. A later Tottenham-specific Opta page, for example, put Spurs' relegation probability at 9.1% in its own later snapshot. It is useful evidence of uncertainty, but it does not belong as another row in the 13 August table.
Why Opta's forecast is not one fixed final table
A club's “most likely finish” is the tallest bar in its own distribution, not a claim that the position is likely in isolation. Opta's 20 August Manchester City page called first City's most likely finish, although City won only 19.6% of those simulations and Arsenal won more often. Tottenham provide an even clearer example: seventh was their modal finish in a later club snapshot, but it only narrowly led a broad range of possible outcomes.
| Concept | What it answers | What it does not mean |
|---|---|---|
| Actual table | Where clubs stand after played matches | A forecast of the final order |
| Expected view | A performance-based comparison under the provider's metric | The official competition standings |
| Live predicted view | An updating model view of the season outcome | A permanent pre-season record |
| Most likely position | The single position with the largest probability for one club | A position with more than a 50% chance |
| Full distribution | How probability is spread across all finishing positions | One deterministic 1–20 ordering |
In Tottenham's 20 August club analysis, every position from fourth to 14th carried between 5.5% and 6.3%. Seventh could lead that set by a fraction while 93% or more of simulated Spurs seasons ended somewhere else. That width is valuable information: it tells a supporter the model sees many plausible ranges. Printing only “Tottenham seventh” throws away almost all of that uncertainty and makes a weakly modal result sound decisive.
Opta does provide an updating table interface with Actual, Expected and Predicted controls, so it would also be wrong to say that Opta never shows a predicted table. The precise distinction is that its static, source-checkable season article publishes a probability distribution and selected thresholds, while the live predicted rows can change. We will not freeze or invent client-rendered 1–20 rows that were not verifiable in the source. Use the live model view for its current forecast and our Premier League table for the result-based standings.
How the Opta supercomputer model works
Opta's public explanation describes a chain, not a magic black-box verdict. Its League Prediction model first estimates win, draw and loss probabilities for matches, using betting-market odds and Opta Power Rankings. The Power Rankings are a separate team-strength system built on hierarchical Elo, match results and, where available, expected-goals information. Those match probabilities then feed repeated simulations of the remaining league schedule.
Method boundary: Opta does not publish every weight, adjustment or line of code in these explainers. “Supercomputer” is the publisher's label for its predictive process; it is not evidence that the output is certain, generated by artificial intelligence, or suitable as betting instruction.
The inputs behind each match probability
The two input families Opta names are betting-market odds and its Power Rankings. Market prices aggregate a large amount of current information, while the rankings provide an independent measure of relative team strength. Opta describes those rankings as hierarchical Elo-based ratings built from results and, when the data exist, expected goals. The league model uses the inputs to estimate three match outcomes—home or away win as applicable, draw, or loss—rather than selecting one score as inevitable.
Elo is designed to move after matches. An expected win by a stronger team produces a smaller exchange of rating points than an upset by a weaker team, and Opta's version can use xG to reflect the quality of chances rather than relying only on the final score. The underlying ratings are then transformed to Opta's zero-to-100 Power Rankings scale. That gives the prediction system a comparable strength signal while still allowing teams to rise or fall as evidence arrives.
There are limits to what the public explanation lets us conclude. Opta does not disclose the exact weighting between market odds and Power Rankings in these pages. Its own fixture analysis also cautioned that rankings shaped by earlier performance may understate or overstate a team after major managerial or squad change. A model can update quickly once matches are played, but supporters should not assume a pre-season rating has perfectly measured every transfer, injury or tactical shift before competitive evidence exists.
How 10,000 simulations become season probabilities
Think of one simulation as one complete possible route through the remaining Premier League fixtures. For every game, the model samples from its win, draw and loss probabilities, records a result, and builds a table. It repeats that process through the schedule. Opta also publishes matchday prediction articles using match-level probabilities, but those answer a narrower question; a weekend win percentage cannot be copied into a season title or relegation table.
After 10,000 season runs, the model counts how often each club finished first, in the top five, in the bottom three, or in every individual position. A published 38.0% title chance is therefore roughly equivalent to 3,800 title outcomes in 10,000 runs, allowing for the displayed figure's rounding. It is explanatory arithmetic, not a claim that Opta separately published an exact unrounded count of 3,800.
- A favourite can still lose most runs: leading a 20-club field does not require more than 50%.
- Thresholds describe different questions: title, top five and relegation probabilities should not be added together.
- Every percentage belongs to a snapshot: new results and updated strength information can change the next run.
- A small probability is not zero: simulations deliberately preserve some unlikely routes through a season.
Why the Opta predictions change during the season
Two official Opta pages can be accurate records of different model runs. The 13 August all-league article placed Arsenal at 38.0% and Manchester City at 20.5% for the title. A Manchester City article based on simulations run on 20 August showed Arsenal at 40.6% and City at 19.6%. Arsenal remained first and City second, but neither pair of percentages should be described as timeless.
| Club | 13 August league-wide run | Later club-page run |
|---|---|---|
| Arsenal | 38.0% | 40.6% (20 August) |
| Manchester City | 20.5% | 19.6% (20 August) |
| Chelsea | 4.1% | 3.8% (20 August) |
| Aston Villa | 4.8% | 4.4% (21 August) |
The later pages are useful update evidence, but they are club features rather than a newly published, complete comparison for all 20 teams. Opta's public methodology explains that team-strength information updates and that remaining fixtures are simulated again. It does not state that any one movement in this table came from a particular transfer, result or injury. Saying the values “changed between snapshots” is supported; assigning a single cause would be speculation.
For a fair all-club comparison, choose the newest complete league-wide snapshot you can verify and keep its date beside every row. Then use the Premier League results to see what new evidence has arrived since that run. If only a newer club article is available, treat it as an update for that club—not permission to combine its number with 19 older values and call the mixture Opta's latest table.
How to use Opta's forecast without confusing it with other tables
Start by deciding which question you are asking. Opta's Predicted view asks where teams may finish. An Actual table asks where they stand after completed matches. An Expected view applies a performance metric and is not the official competition order. Switching between those labels without noticing can make a model forecast look like a result—or make a performance estimate look like awarded points.
- Check the publisher.Confirm that an “Opta” number comes from Opta Analyst or Stats Perform, not another site's supercomputer.
- Record the run date and view.Write down whether you are viewing Actual, Expected or Predicted data and when the model was run or page updated.
- Compare with reality.Use the current table and completed results to see what has happened since the snapshot.
- Inspect what remains.Check the Premier League schedule before drawing conclusions from a club's position or run of opponents.
- Keep opinion separate.Read our editorial 1–20 forecast as a distinct judgement, not an Opta output.
The official 2026/27 fixture list contains 380 league matches, but the Premier League also warns that fixture dates can change. A season probability does not confirm a kickoff time, television channel or rearranged date. Use it to understand competitive likelihood, then return to the live schedule for planning. The model and the fixture list solve related but different supporter tasks.
Publisher labels are equally important in search results. Sky Sports published its own 10,000-simulation 1–20 forecast with stated inputs and projected points. That does not make Sky's table an Opta table, even if both models choose the same champion. Similar conclusions can emerge from different data, assumptions and methods. Preserve the brand, timestamp and output type together whenever you quote a prediction.
Frequently asked questions about Opta's 2026/27 predictions
These answers refer to Opta's complete league-wide simulation run dated 13 August 2026 unless a later page is explicitly named. The official live table can update, so the date is part of the answer—not a footnote to ignore.
They also distinguish the season Predicted view from Opta's matchday forecasts. One estimates the shape of the final league outcome; the other estimates win, draw and loss probabilities for specific fixtures. Opta does not state a fixed update cadence on the reviewed pages.
Who are Opta's favourites to win the Premier League in 2026/27?
Arsenal led Opta's 13 August league-wide snapshot with a 38.0% title probability, followed by Manchester City at 20.5% and Liverpool at 9.2%. Arsenal and City remained first and second in a later 20 August Opta snapshot, although their exact percentages changed. “Favourite” means the club won more simulations than any rival; it does not mean Arsenal were more likely to win than the other 19 clubs combined.
Did Opta publish a complete 1-20 final table?
Not as a fixed 1–20 list in the static 2026/27 season article. That article publishes finishing-position probabilities and selected title, top-five and relegation thresholds. Opta does also offer a live Premier League table interface with a Predicted mode, but those rows can update. Treat it as a current model view, not a permanent pre-season ranking. For what has actually happened, use the results-based table.
Are Opta's Premier League predictions guaranteed?
No. Opta estimates likelihoods and counts outcomes across repeated simulations. Arsenal led the 13 August title forecast at 38.0%, which means most modeled seasons still produced another champion. At the other end, almost every club was relegated in at least a small share of runs. That uncertainty is part of the result, not a model failure. The percentages are analytical estimates, not promises, betting advice or evidence that an upset cannot happen.
Where can I find the newest Opta Premier League prediction?
Use Opta Analyst's 2026/2027 competition table and select its Predicted view for the updating season outlook. Opta's match-prediction articles answer a different question: the win, draw and loss chances for a particular Matchday. Check the displayed date in either place, because Opta does not state a fixed public update timetable on the pages reviewed here. Then compare upcoming games with the current Premier League schedule.
Comments
Ask a useful question or share a helpful tip. Comments are reviewed before publication.
Loading comments…