
The traditional Premier League Big Six are Arsenal, Chelsea, Liverpool, Manchester City, Manchester United and Tottenham Hotspur. Their all-time records depend on what you count: accumulated league points, championships, goals for an individual club or results against the other five. Manchester United lead the Premier League title count with 13 championships, but that does not make every other comparison redundant. A club can rank higher for total points than for trophies, and a famous scorer's career total can differ from the goals he scored for the club you support.
This guide uses a fixed historical window: 1992/93 through the completed 2025/26 season, ending on 24 May 2026. It excludes 2026/27 matches, the old First Division and cup competitions. Keeping that endpoint consistent makes the tables comparable and stops a current-season update from quietly changing one part of the story. The aim is to explain what the records reveal, where their limits lie and which comparison actually answers your question.
Which clubs and seasons belong in this comparison?
The six names are held constant throughout this article. “Big Six” is an informal football label, not a division within the competition or a qualification rule. That matters when a supporter asks for the “Big Six all-time table”: replacing a struggling member with the club currently sixth would create a different dataset. The Premier League's own 2024/25 review used the traditional six while discussing how other clubs were challenging their dominance. The comparison remains useful precisely because membership stays stable when performances change.
The starting point is the first Premier League campaign, 1992/93. An older English championship remains a genuine league achievement, but belongs in a combined top-flight record rather than a Premier League-only total. Likewise, a season in the second or third tier cannot add points to this table. The distinction is especially important for clubs with substantial histories before the Premier League began: a smaller number here does not erase their earlier success. It simply answers a narrower question about this particular competition.
Terms such as “Big Seven” and “Big Eight” require an extra definition. They have been used in discussions about clubs joining or challenging the established group, with membership changing according to the writer and period. There is no universal extra club that can be silently appended to every historical table. If you want to compare Newcastle United or Aston Villa alongside the six, name that expanded group and recalculate the relevant results. Adding a seventh name to a headline while retaining six-club figures would leave the reader with an unclear comparison.
The endpoint needs equal care. Everything numerical here stops at the end of 2025/26; the season in progress is excluded even if an interactive statistics page has already added more games. That gives a reproducible historical view. For the current title race, use the Premier League table, where the season and matches played matter more than accumulated history. A club's historical standing is background for watching it now, not a shortcut to forecasting its next result.
Reading the Big Six all-time Premier League points table
An all-time points table adds league results across seasons. It includes games against every Premier League opponent, so a win over a club outside the Big Six contributes exactly as much as a win over another member. Cup victories, European games and friendly matches add nothing. This is why the table measures sustained league accumulation rather than the outcome of a separate rivalry competition. The same scoring convention applies throughout this Premier League window: three points for a win, one for a draw and none for a defeat.
The figures below are calculated from James Curley's historical match dataset and Football-Data's recent completed seasons, with the end-of-season totals cross-checked against EFC Statto's historical table. They show points earned from match results, using three times wins plus draws; administrative deductions are not subtracted. This is a stated statistical convention, not a claim that the table was exported from the official live standings dashboard.
Cumulative points through the end of 2025/26
Manchester United lead this comparison on 2,614 earned points. The table ends after the final matches on 24 May 2026 and uses the same date for all six clubs. “Played” therefore means completed Premier League games within the historical window, rather than a current-season game count. Wins, draws and defeats are shown alongside points so you can see how the total is built and recognise that a long-term lead combines many different teams and managerial periods.
| Club | Played | Wins | Draws | Defeats | Earned points |
|---|---|---|---|---|---|
| Manchester United | 1,304 | 775 | 289 | 240 | 2,614 |
| Arsenal | 1,304 | 719 | 316 | 269 | 2,473 |
| Liverpool | 1,304 | 694 | 320 | 290 | 2,402 |
| Chelsea | 1,304 | 681 | 323 | 300 | 2,366 |
| Tottenham Hotspur | 1,304 | 561 | 309 | 434 | 1,992 |
| Manchester City | 1,114 | 573 | 239 | 302 | 1,958 |
For United, the arithmetic is 775 wins multiplied by three, plus 289 draws, producing 2,614 points. Their advantage over Arsenal at this endpoint is 141 points. That gap describes accumulated history, not the number of points separating the clubs in a single season. It can survive a period in which the club below performs better, because the starting difference was built over many previous campaigns. Equally, a change in that historical gap says something about recent relative accumulation without automatically identifying the season's champion.
A useful check when comparing another table is whether it includes the whole 2025/26 campaign. United earned 71 league points that season and Arsenal earned 85, but those are season additions to the much larger historical totals. A table that adds one club's latest season while leaving another at the previous endpoint is not comparable. Nor should a newer live total be read as evidence that this dated table is wrong: it may simply include matches after the cutoff. Always read the season or date label before comparing the numbers.
Why points per game changes the comparison
Tottenham have 34 more cumulative points than Manchester City in this window, yet City's average is higher: 1.758 points per game against Spurs' 1.528, rounded to three decimal places. The reason is the denominator. Divide each club's earned points by its own completed Premier League matches, rather than assuming both have played the same number. The rate answers “how many points did this club earn per included game?” while the total answers “how much did it accumulate altogether?” Both questions are useful, but their rankings need not match.
City have played 190 fewer Premier League games than the other five. Their missing seasons in this window are 1996/97, 1997/98, 1998/99, 1999/00 and 2001/02. Those seasons cannot earn Premier League points because City were outside the division. The gap is not a set of outstanding fixtures or an entitlement to additional points. For the ever-present clubs, the first three 42-match campaigns and the following 31 seasons of 38 matches add up to 1,304 games. City's different exposure makes a per-game comparison especially informative.
The full rate order is United 2.005, Arsenal 1.896, Liverpool 1.842, Chelsea 1.814, City 1.758 and Tottenham 1.528. Only the final two change places compared with the cumulative-points ordering here. That does not make the rate a complete judgement of club greatness: it averages strong and weak eras together, excludes time outside the competition and gives no extra weight to winning a title. For a supporter comparing long-term consistency, reading totals alongside rates is more useful than choosing whichever column puts a favourite club higher.
Premier League titles tell a different story
Manchester City move from sixth in cumulative points to second in Premier League championships. Tottenham move from fifth in points to the only member without a Premier League title. A championship rewards finishing first in an individual season; an all-time points table keeps adding results whether a team finishes first, second or much lower. That difference explains why a trophy ranking and a consistency ranking tell contrasting stories without either being incorrect. It also explains why a single exceptional campaign can matter enormously in club history while changing a long-term points total only modestly.
| Club | Premier League titles | Most recent title by cutoff |
|---|---|---|
| Manchester United | 13 | 2012/13 |
| Manchester City | 8 | 2023/24 |
| Chelsea | 5 | 2016/17 |
| Arsenal | 4 | 2025/26 |
| Liverpool | 2 | 2024/25 |
| Tottenham Hotspur | 0 | No Premier League title |
The completed-season cutoff is important for Arsenal's row. Their 2025/26 championship took their Premier League total to four; a comparison stopping one season earlier would show three. Across the whole window, these six clubs won 32 of the 34 championships. The exceptions were Blackburn Rovers in 1994/95 and Leicester City in 2015/16. Those wins belong in a league-wide honours list even though those clubs are outside this fixed comparison. Historical concentration of success does not make the group an exclusive list of possible champions.
Other records describe the character of an outstanding season rather than the number of championships. City's 100 points in 2017/18 measure a points peak; their four successive titles from 2020/21 through 2023/24 measure a winning sequence. Arsenal's unbeaten 2003/04 campaign measures avoiding defeats, while Chelsea's 15 goals conceded in 2004/05 measure defensive outcomes. The league's records page keeps those achievements in separate categories. Combining them into one undefined “best ever” score would hide the very qualities that make them interesting to supporters.
Read the zero in Tottenham's row with the same precision as the positive numbers. It means no championship in this competition and period; it does not mean no English league titles before 1992 or no success in other competitions. Conversely, a cup victory cannot be added to a Premier League championship count. If the debate is about overall honours, widen the competition scope explicitly. If the question is whether a club will qualify for Europe now, return to the current season and its rules. The historical trophy table answers neither question on its own.
The record Premier League goalscorers for each club
A club's record Premier League scorer is the player with the most goals for that club in this competition. It is a narrower category than the club's all-competition scoring record, and different from the Premier League's career leaderboard. The six leaders below count domestic league goals in the Premier League era only. Goals scored for a previous or later employer cannot be added to the named club's row, however closely that player is associated with it in supporters' memories.
| Club | Record Premier League scorer | Goals for this club by end 2025/26 |
|---|---|---|
| Arsenal | Thierry Henry | 175 |
| Chelsea | Frank Lampard | 147 |
| Liverpool | Mohamed Salah | 191 |
| Manchester City | Sergio Aguero | 184 |
| Manchester United | Wayne Rooney | 183 |
| Tottenham Hotspur | Harry Kane | 213 |
Salah's figure needs the same endpoint as the rest of the article. Liverpool's retrospective after 2025/26 identifies 191 Premier League goals for the club, and the league's final-day review confirms that club-only figure. Older milestone reports give lower totals because they describe earlier dates. The useful habit is to read the competition, club and endpoint together, rather than treating any article with “all-time” in its headline as a permanently current number.
This table is also a reminder that record goalscorers do not all have identical jobs. Chelsea's leader is Lampard, a midfielder, while other rows are dominated by forwards. The totals show what each player accumulated for his club, but do not control for career length, playing position, penalties, minutes or the chances created by team-mates. Those factors matter when supporters move from identifying a record to judging performances. A higher number is a clear scoring achievement; it is not, by itself, a complete comparison of every player's contribution.
Club goals versus a player's full Premier League career
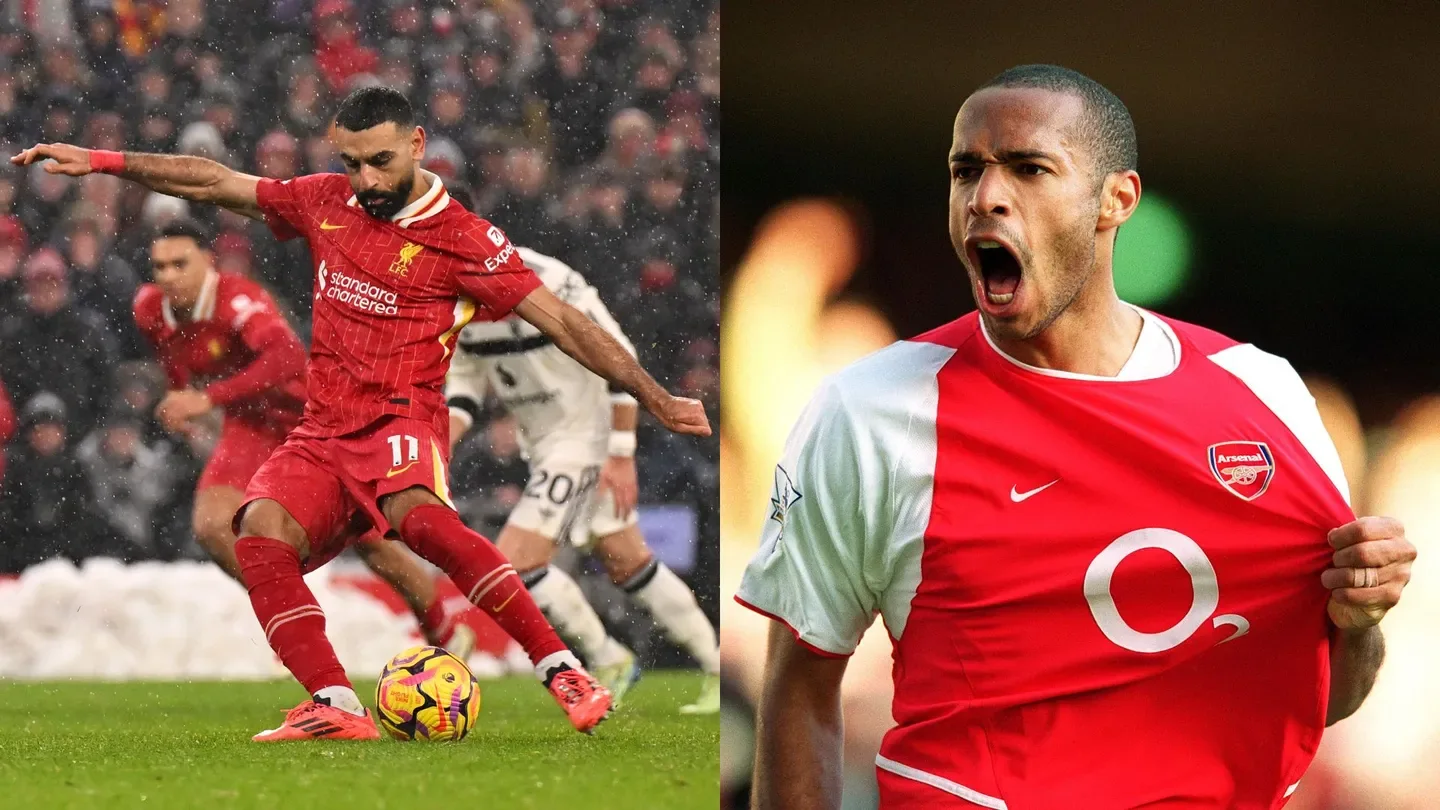
Rooney's full Premier League career total is 208, but his United total is 183. Lampard's career figure is 177, while his Chelsea figure is 147. Both versions can be correct because the career leaderboard includes goals for other Premier League clubs. A player associated most strongly with one team does not lose the goals he scored elsewhere; they simply belong outside that team's club-only record. If a comparison gives Rooney 208 in a table labelled “goals for Manchester United”, the label and number have been combined incorrectly.
Henry's 175 happen to serve as both his Arsenal total and his entire Premier League total. That equality should not become an assumption about everyone else. At this article's endpoint, Salah has 193 career Premier League goals and 191 for Liverpool. When checking a scoring rate, the appearances must follow the same filter as the goals: use club appearances for club goals, and career appearances for career goals. Dividing a full-career goal total by matches at only one club would create an inflated rate without adding any meaningful insight.
There is another common switch in modern comparisons: “goal involvements” combines goals and assists, while this table counts goals alone. A larger involvement figure does not contradict a smaller scoring total; it measures a broader contribution. The Golden Boot introduces a different time boundary again, rewarding the leading scorer within one season rather than across a whole career. Before sharing a record, check three labels: the competition, whether the number belongs to a club or a career, and whether the metric is goals, assists or their combination. Those checks resolve many apparent disagreements between otherwise accurate tables.
A Big Six head-to-head table answers a different question
A head-to-head mini-table counts only Premier League matches in which both opponents belong to the selected six. Arsenal against Tottenham qualifies; Arsenal against Everton does not. That is the sense in which the league's analysis of performances against fellow Big Six clubs separates rivalry results from a team's overall form. For an all-time version, the same traditional membership must be applied retrospectively. Otherwise, changing the list each season would make the historical rows measure different sets of opponents.
| Club | Selected matches | Earned points |
|---|---|---|
| Manchester United | 330 | 526 |
| Liverpool | 330 | 487 |
| Chelsea | 330 | 485 |
| Arsenal | 330 | 466 |
| Manchester City | 290 | 348 |
| Tottenham Hotspur | 330 | 330 |
This separate calculation uses the same historical results compiled by James Curley and Football-Data season files, retaining only fixtures between the fixed six. Liverpool and Chelsea move above Arsenal when the opponent filter changes, although Arsenal has more earned points against the whole league. City's 290 selected matches also matter: its absences from the division removed meetings with these rivals, leaving fewer opportunities than the other clubs' 330. The table therefore describes a particular historical record. Its cumulative points cannot establish how equally experienced teams would perform against one another today.
A single-season mini-table asks a narrower question again. The six clubs' meetings in 2025/26 produced 30 distinct fixtures, with ten matches per club: home and away against five selected opponents. That can help explain whether a team's problem lay in the biggest named rivalries or elsewhere in the league. It cannot replace the final standings, because every point earned against another league opponent still counts towards the championship. The all-time version also retains results from periods when these clubs had different resources and standing. It measures games played under a fixed filter, rather than reconstructing a modern reputation ranking for each past season.
There is no automatic seventh club to append to this calculation. A “Big Seven” table needs an explicitly named additional team and a fresh calculation for every row, because that club's meetings with all six would now qualify. Selecting a seventh team for a particular discussion is possible; treating the name alone as a standard dataset is not. The same principle applies to a “Big Four” or “Big Eight” comparison. Before reading any claimed record, establish the membership and whether it remains fixed across the years. Without that information, apparently conflicting tables may simply count different matches.
Choose the record that matches the question you actually want answered. Cumulative league points describe the accumulated results against everyone; points per game account for different numbers of appearances; titles count completed championship campaigns; club goals identify a scorer within a specific team and competition. A head-to-head table adds an opponent restriction to the league record. For an upcoming rivalry, use the Premier League fixtures this weekend to find the scheduled match, then keep any historical comparison labelled with its own cutoff. The tables here stop at the end of 2025/26, rather than mixing completed history with an evolving 2026/27 season.
Comments
Ask a useful question or share a helpful tip. Comments are reviewed before publication.
Loading comments…